A primary goal of the LOTUS Report was to improve the understanding of stratospheric ozone trends and their uncertainties, given that results from various previous studies differed significantly, depending on the data sets and analysis methods used.

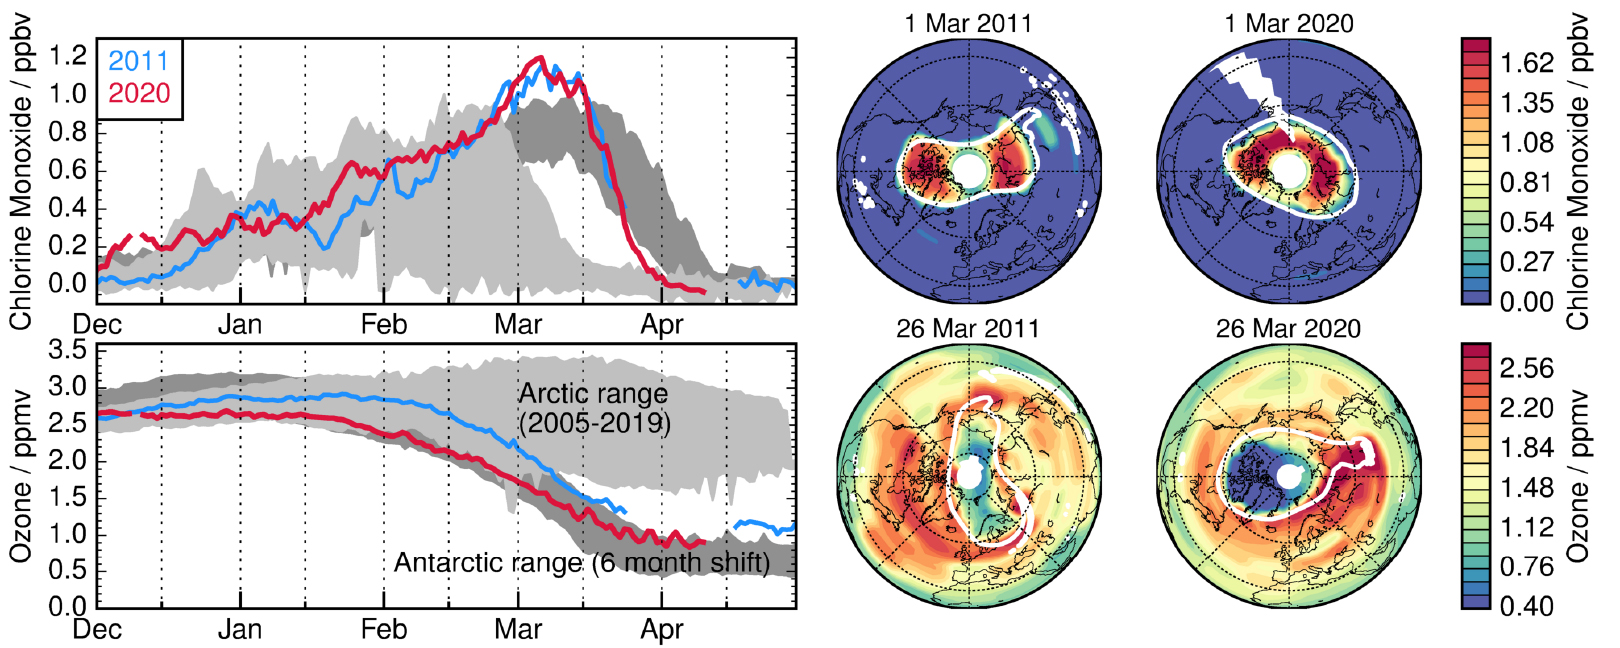
Left: Red lines show 2019/2020 MLS observations of Arctic vortex-average chlorine monoxide (ClO, upper), both a marker and an agent of chemical ozone destruction, and ozone itself (lower) at about 17 km altitude (460 K potential temperature). Blue lines show 2010/2011, the previous record holder. Pale grey shading is the 2004–2018 range; darker grey shading is the Antarctic range (shifted by six months). Right: Maps compare selected days in the Arctic in 2011 and 2020. White lines mark the polar vortex – the region within which ozone destruction is confined.
A primary goal of the LOTUS Report was to improve the understanding of stratospheric ozone trends and their uncertainties, given that results from various previous studies differed significantly, depending on the data sets and analysis methods used.
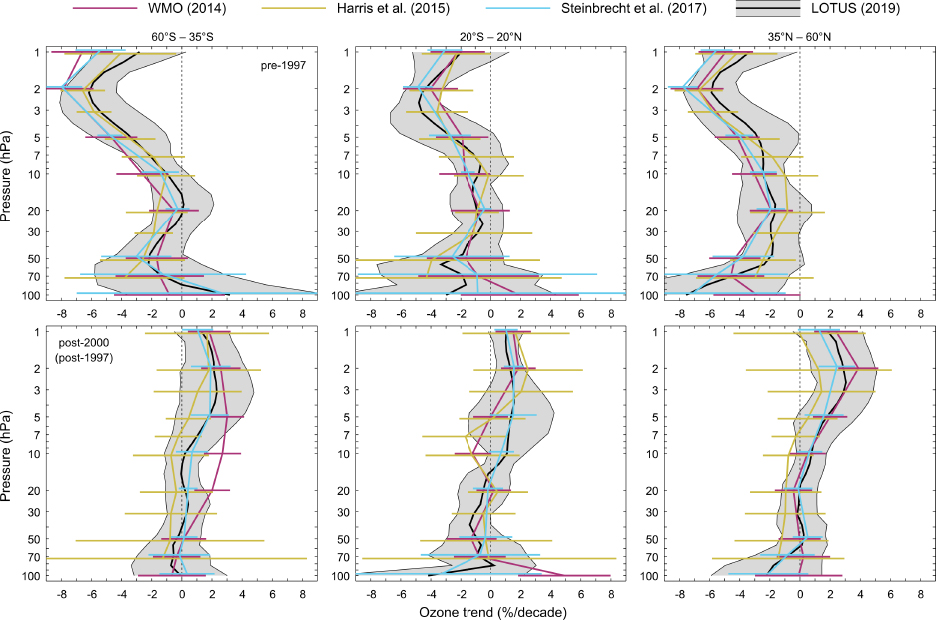
Many of the satellite data records used for LOTUS were improved for trend analyses (with updated data sets or merging methods, or corrections for sampling, calibration, or drifts). Aura Microwave Limb Sounder (MLS) data (post-2004) are a key part of the merged records during ozone’s ongoing slow recovery period. The most significant ozone trends occur at mid-latitudes near 2 hPa (~45 km), with a ~6%/decade decline prior to the ODS peak, and a 2 to 3%/decade recovery subsequently. LOTUS also refined error analysis approaches. Further work to reconcile data differences prior to merging is well worth pursuing.
Understanding stratospheric ozone trends is of great societal importance. It ensures that the measures taken by the Montreal Protocol and subsequent amendments to reduce ODSs continue to protect the ozone layer, and thus, life on Earth.

Fig. from Executive Summary of the SPARC/IO3C/GAW LOTUS Report (2019): Overview of ozone profile trends from past and recent assessments (see legend above). The top row shows the ozone trends before the turnaround (decline) of ODSs and the bottom row refers to the post- peak-ODS period. Shaded areas and error bars represent the 95% confidence intervals, based on estimates from various combinations of instrument data records.
Technical description of figure:
Overview of ozone profile trends from past and recent assessments (see legend). Top row shows the ozone trends before the turnaround (decline) of ODSs and bottom row refers to the post-peak ODS period (with some slight differences in time periods used by various assessments). Shaded areas and error bars represent the 95% confidence intervals, based on estimates from combinations of various instrument data records. Details of the error estimates are described in Chapter 5 of the LOTUS Report.
Scientific significance, societal relevance, and relationships to future missions:
Detailed assessments of ozone trends during the current slow ozone recovery phase in a changing climate are a cornerstone of stratospheric research. Ozone trends can arise from changes in dynamics and temperature, as well as from declining ODSs. Improvements in the estimates of ozone trends and their uncertainties, continuation of reliable long-term data records, and trend comparisons with model expectations, are all key aspects of the WMO Ozone Assessments, which occur every four years.
There are few confirmed plans for future missions (especially NASA-led) providing stratospheric ozone profiles with good (daily) global coverage. The Ozone Mapping and Profiler Suite (OMPS) instruments may be able to fulfill the needs for ozone profile trend assessments in the future, albeit without the more complete chemical composition profile data that can be used to more fully characterize the state of the stratosphere.
Data Sources:
A large number of satellite and ground-based data sets (too numerous to mention here individually) was included in the LOTUS Report analyses of ozone trends and uncertainties. With nearly global coverage and data over 30+ years (1985 to 2016), merged satellite data records make up the backbone of LOTUS ozone trend analyses. Aura Microwave Limb Sounder (MLS) data feature prominently in the post-1997 merged data records (in data records named GOZCARDS and SWOOSH); all data sets are publicly available or provided directly (with updates) from data provider teams. With respect to ground-based measurements, LOTUS used individual records from passive and active remote sensing techniques as well as from ozonesondes, including a few homogenized sonde records that existed at that time. In addition to observations, CCMI model simulations were used to test theoretical understanding of ozone profile trends; these model results represent the first analysis of trends in the vertical distribution of ozone from the “CCMI-1 REFC2” simulations.Refer to the LOTUS report for more details.
References: SPARC/IO3C/GAW, 2019: SPARC/IO3C/GAW Report on Long-term Ozone Trends and Uncertainties in the Stratosphere, I. Petropavlovskikh, S. Godin-Beekmann, D. Hubert, R. Damadeo, B. Hassler, V. Sofieva (Eds.), SPARC Report No. 9, GAW Report No. 241, WCRP-17/2018, doi: 10.17874/f899e57a20b, available at www.sparc-climate.org/publications/sparc-reports. See also https://www.sparc-climate.org/publications/sparc-reports/sparc-report-no-9. SPARC: Stratosphere-troposphere Processes And their Role in Climate; IO3C: International Ozone Commission; GAW: Global Atmosphere Watch.
5.2020