
Fig. 1. This shows a positive correlation between long-term variations in upper mesospheric ozone (red) and solar ultraviolet (blue).
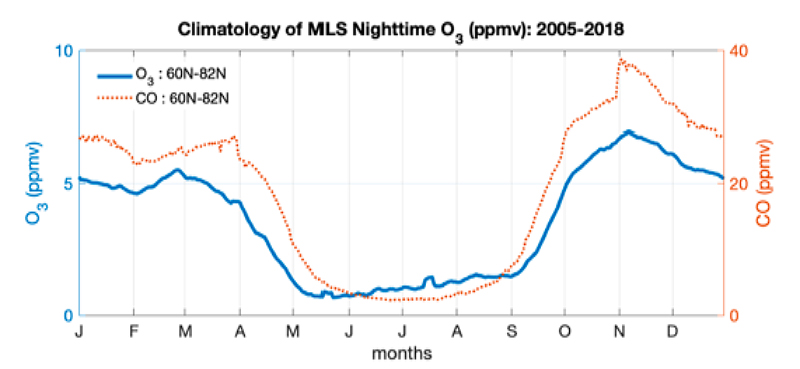
Fig. 2. Climatology (for 2005-2018) of MLS nighttime O3 (blue) and CO (red) at 0.002 hPa (near 90 km) for latitudes 60°N–82°N.
Using a Lagrangian process model that includes meteorological fields with and without the process of sublimation of convectively lofted ice particles, Wang et al. confirm that the temperatures near the tropical tropopause have the largest impact on the seasonal cycle of humidity. However, observed humidity patterns are more accurately captured by including convective processes. For example, the larger amplitude of northern hemispheric water vapor seasonal cycle compared to that in the southern hemisphere can only be reproduced by including ice sublimation in the model runs.
Stratospheric water vapor has a significant impact on the atmospheric radiation budget and stratospheric ozone concentrations. Improved understanding of the relevant processes that control the observed patterns in humidity is therefore essential for understanding climate feedbacks and improving projections.
Fig. 1. This shows a positive correlation between long-term variations in upper mesospheric ozone (red) and solar ultraviolet (blue).
Fig. 2. Climatology (for 2005-2018) of MLS nighttime O3 (blue) and CO (red) at 0.002 hPa (near 90 km) for latitudes 60°N–82°N.
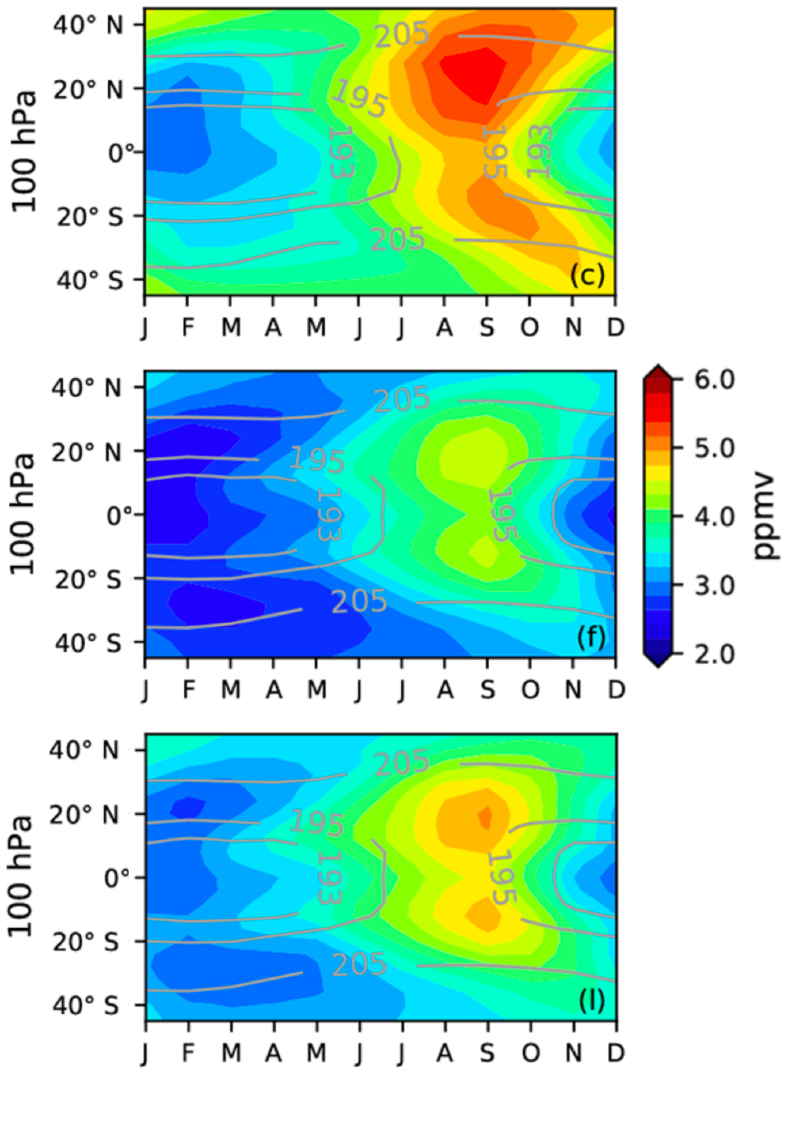
(a) Monthly means of MLS humidity observations at 100 hPa (~16 km) from 08/2004–10/2018 are compared to a Lagrangian process model (b) without and (c) with ice sublimation. Colors indicate water vapor mixing ratios; gray lines temperature.
Technical description of figure:
Zonal mean seasonal cycle of water vapor at 100 hPa (in units of ppmv, color shading) and temperature (in units of K, contour lines) between 40°S and 40°N from (a) MLS observations, (b) a forward, domain-filling, diabatic trajectory model driven by ERA-Interim (ERAi) meteorological fields without sublimation of convectively lofted ice particles, and (c) the ERAi driven trajectory model including ice sublimation. MLS data is derived from the daily standard water vapor product between August 2004 to October 2018, aggregated to monthly means on a horizontal grid with a spatial resolution of 4° in latitude by 8° in longitude.
Scientific significance, societal relevance, and relationships to future missions:
Because stratospheric water vapor acts as a significant greenhouse gas and has a strong impact on chemical processes, it is essential to understand and accurately describe the relevant mechanisms that control humidity in the upper troposphere and lower stratosphere. This study acknowledges the importance of the seasonal variability of temperatures in the region near the tropopause, but also illustrates the need for a better understanding of the role of convectively injected water vapor. While the applied trajectory model cannot fully represent the satellite measurements of water vapor, it is able to better reproduce the observed seasonal and geographic patterns by including sublimation of lofted ice particles.
Daily near-global observations of upper tropospheric and lower stratospheric water vapor from the Microwave Limb Sounder (MLS) instrument on NASA’s Aura spacecraft are essential for validating this (and other) models, both in terms of geographical distribution (as in this figure) and the temporal evolution of water vapor distributions. There are currently no plans from any agency for a new instrument to extend the 15-year spaceborne daily near-global MLS record of water vapor observations in the upper troposphere and lower stratosphere.
Data Sources:
Aura Microwave Limb Sounder observations are available from the NASA Goddard Space Flight Center Earth Sciences (GES) Data and Information Services Center (DISC). Cloud-Aerosol Lidar with Orthogonal Polarization (CALIOP) data are available from the NASA Langley Research Center Atmospheric Science Data Center at https://eosweb.larc.nasa.gov/. The ERA-Interim meteorological fields provided by ECMWF are available at https://www. ecmwf.int/en/forecasts/datasets/. The monthly water vapor data from the Lagrangian models driven by the Goddard Earth Observing System Chemistry-Climate Model (GEOSCCM), ERAi, and Modern-Era Retrospective analysis for Research and Applications 2 (MERRA-2) meteorology are available at https://doi.org/10.5281/zenodo.3543818.
References: Wang, X., Dessler, A. E., Schoeberl, M. R., Yu, W., and Wang, T.: Impact of convectively lofted ice on the seasonal cycle of water vapor in the tropical tropopause layer, Atmos. Chem. Phys., 19, 14621–14636, https://doi.org/10.5194/acp-19-14621-2019, 2019.
5.2020

