NASA logo

Aura Science
Observations

Solar Cycle Modulation of Nighttime Ozone Near the Mesopause


What do long-term observations of ozone (O3) profiles from the Microwave Limb Sounder (MLS) aboard the Aura satellite tell us about the drivers of O3 variations near 90 km altitude (the secondary ozone maximum region), notably in relation to the 11-year solar cycle?

 This shows a positive correlation between long-term variations in upper mesospheric ozone (red) and solar ultraviolet (blue).

Fig. 1. This shows a positive correlation between long-term variations in upper mesospheric ozone (red) and solar ultraviolet (blue).

 Climatology (for 2005-2018) of MLS nighttime O<small><sub>3</sub></small> (blue) and CO (red) at 0.002 hPa (near 90 km) for latitudes 60°N–82°N.

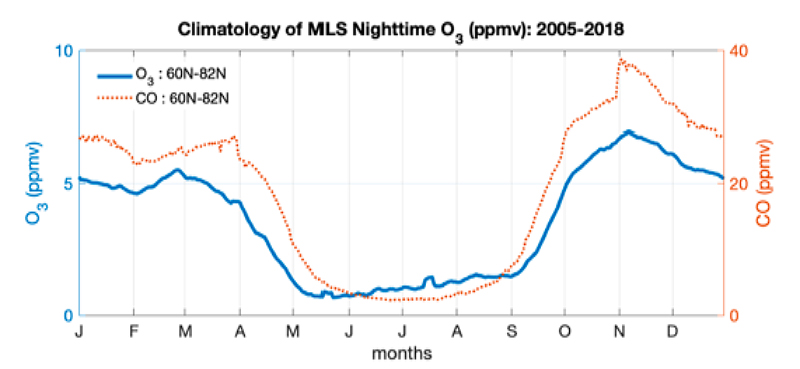
Fig. 2. Climatology (for 2005-2018) of MLS nighttime O3 (blue) and CO (red) at 0.002 hPa (near 90 km) for latitudes 60°N–82°N.

Data and Results:
  • 11‐year solar cycle variations of nighttime O3 near the secondary O3 maximum layer in the upper mesosphere are analyzed with Aura MLS observations since 2004, fully covering solar cycle 24. We note that daytime O3 values are much lower than at night in this region.
  • Produced from recombination of O2 with atomic oxygen (O) transported downward from the lower thermosphere, mesospheric nighttime O3 is proportional to the atomic oxygen density, which is modulated by solar cycle ultraviolet (UV) variations.
  • MLS nighttime ozone data and UV data at 240 nm from the Solar Radiation and Climate Experiment (SORCE) Solar‐Stellar Irradiance Comparison Experiment (SOLSTICE) show a positive correlation over the solar cycle; see Fig.1 for polar night data in both hemispheres.
  • Nighttime O3 and carbon monoxide (CO) abundances are highly correlated in the upper mesosphere (see the climatologies in Fig. 2). In this region, O3 and CO show similar seasonal and solar cycle variations at various latitudes, as their photochemistry is strongly UV-dependent. At high latitudes, their variations are modulated by vertical transport of O and CO2, respectively, and by Eddy diffusion.

This work is significant for our improved understanding of the variations in upper atmospheric ozone, which protects the Earth from the harmful effects of solar UV radiation.


Technical description of figure:
Figure 1. Shown in red are high latitude (a) Northern Hemisphere (60°N–82°N) and (b) Southern Hemisphere (60°S–82°S) zonal mean MLS ozone anomalies (ppmv) during early winter (November/December for the North and March/April for the South) at 0.002 hPa. The overlaid blue curves are SORCE SOLSTICE UV values (in W/m2/nm) at 240 nm to illustrate the UV variation during the same period. The error bars are standard deviations based on daily values during the two months of analysis.

Figure 2. Blue: Climatology of MLS nighttime ozone volume mixing ratio (ppmv) at 0.002 hPa during the MLS observation period (2005–2018) for northern hemisphere high latitudes (60°N–82°N). Red: the same, but for MLS nighttime CO abundances.

Scientific significance, societal relevance, and relationships to future missions:
This work is significant for our improved understanding of the variations in upper atmospheric ozone, which protects the Earth from the harmful effects of solar UV radiation. In terms of future satellite data, there are very few confirmed plans for future missions such as MLS with a focus on global vertically-resolved composition measurements from the upper troposphere to the upper mesosphere.

Data Sources:
Aura Microwave Limb Sounder (MLS) data are publicly available from https://disc.gsfc.nasa.gov/datasets?keywords=MLS&page=1. SORCE SOLSTICE UV data are publicly available from https://lasp.colorado.edu/home/sorce/data/ssi-data/solstice-high-resolution-daily-product/.

References: Lee, J. N., and Wu, D. L. (2020), Solar cycle modulation of nighttime ozone near the mesopause as observed by MLS, Earth and Space Science, 6, https://doi.org/10.1029/2019EA001063.


7.2020