This study shows that:

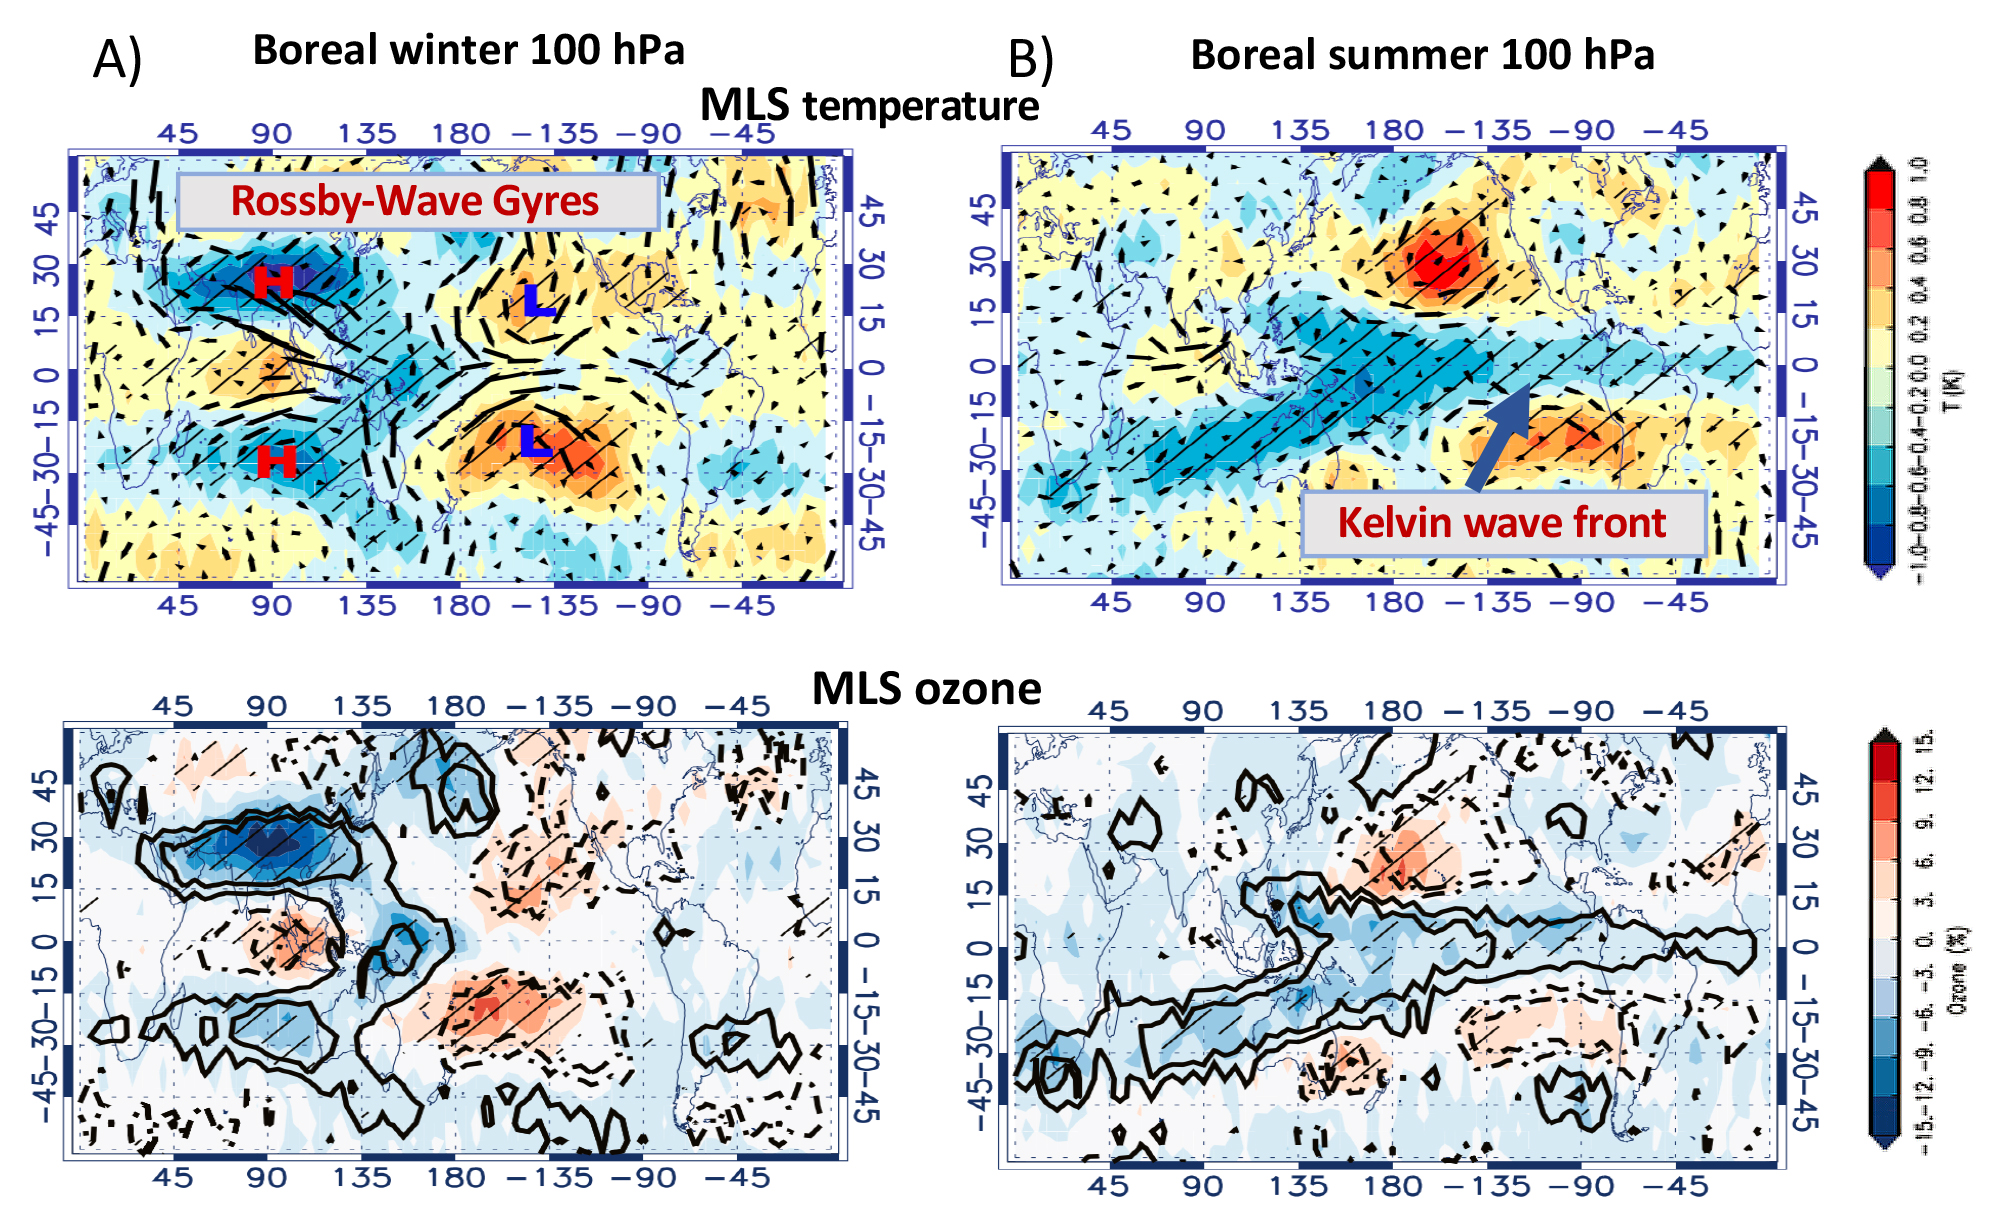
Figure 1. Atmospheric sensitivities to the MJO are revealed by (top) 100 hPa MLS temperature (K) and MERRA-2 winds, and (bottom) ozone (% relative to the climatological annual mean) in boreal winter (Nov – Feb, left) and summer (June –Sep, right) months. For the latter, deep convection associated with the MJO is located over the Indian Ocean.

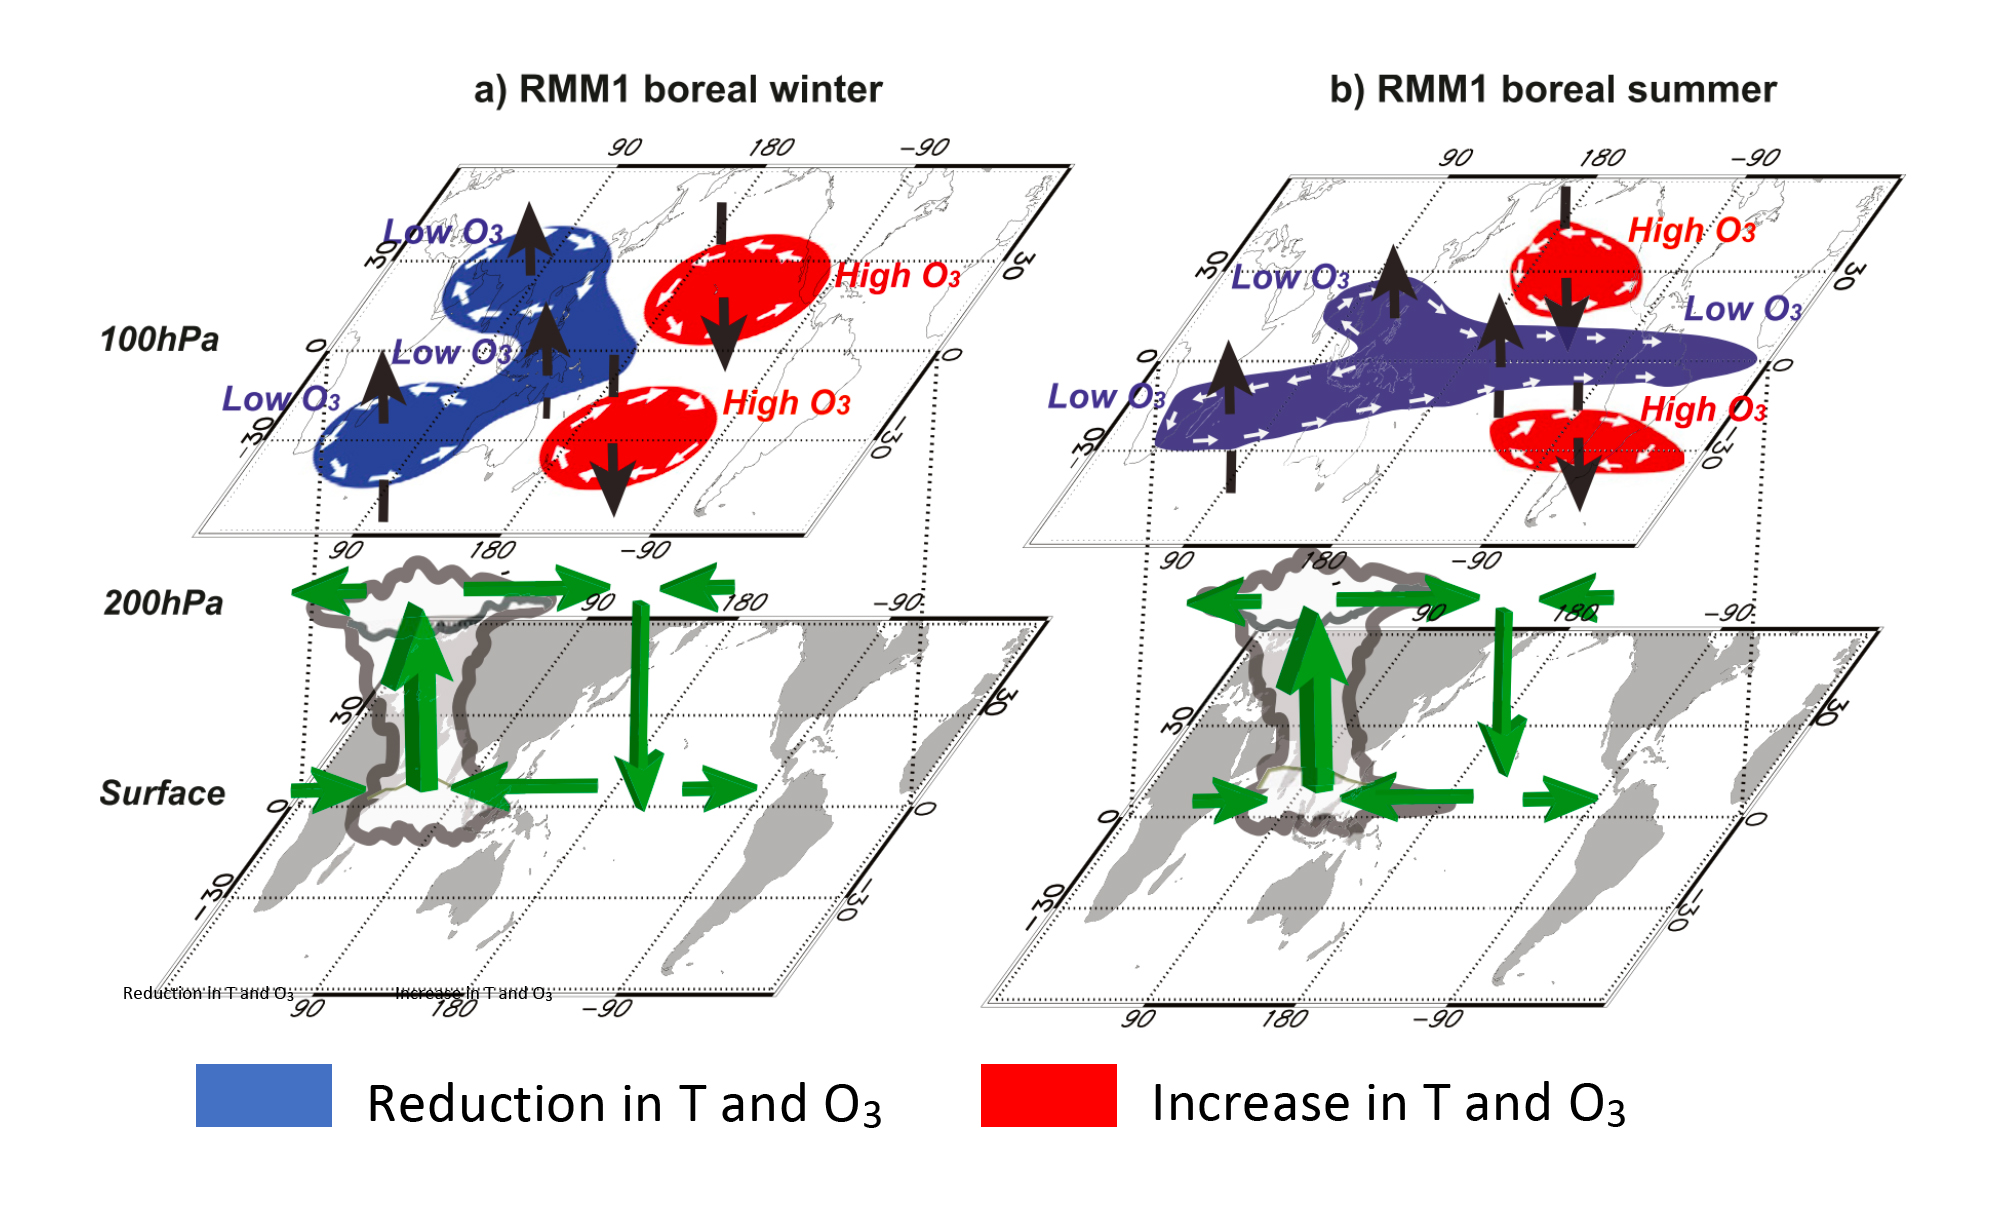
Figure 2. Schematic depiction of the 100-hPa temperature, circulation, and ozone anomalies associated with the MJO when the enhanced convection is centered across the Indian Ocean (RMM1)
Technical Description of Figure:
Figure 1: The 20–90-day bandpass-filtered (top) temperature and (bottom) ozone from MLS (shaded) and horizontal winds from MERRA-2 (arrows) at 100 hPa, regressed onto RMM1 index during boreal (Panel A) winter (NDJF) and (Panel B) summer (JJAS) months. Solid (dashed) contours overlaying ozone maps correspond to the 100 hPa temperature sensitivities with values of +(-) 0.2 and + (-) 0.4 K. Hatching indicates regions that are statistically significant at the 95% confidence level using the Student’s t test. Centers of high and low pressure systems (anticyclones and cyclones respectively) are indicated by H and L, respectively
Figure 2: Schematic depiction of the 100 hPa temperature, circulation, and ozone anomalies associated with the MJO when the enhanced convection is centered across the Indian Ocean (RMM1) during (a) boreal winter and (b) boreal summer months. Blue (red) regions correspond to areas of negative (positive) temperature and ozone perturbations. The circulation cells (white arrows) at the 100 hPa level highlight characteristic wind anomalies associated with the MJO. Vertical motions are shown by vertical black arrows [adopted from Rui and Wang,1990].
Scientific significance, societal relevance, and relationships to future missions:
The intraseasonal (20–90 day) variability of the tropical upper-troposphere and lower-stratosphere (UTLS) is dominated by the Madden–Julian Oscillation (MJO). The MJO’s impact on UTLS chemical constituents (such as ozone (03), which shields all living organisms from harmful Ultra-Violet (UV) radiation, and water vapor (H2O), which is an important greenhouse gas) extends far beyond the tropics. As summarized in Figure 2, trace gas response is significantly different during boreal winter than summer, and is in agreement with the MJO-induced changes in the temperature and circulation. The analysis of MLS observations presented in this study is useful for evaluation and validation of the MJO-related physical and dynamical processes in models.
For instance, it is highly desirable to examine the ability of a range of models to simulate seasonal differences in the UTLS temperature and circulation due to the MJO. The inability of the CCMs to accurately generate shorter-time-scale variability such as that from the MJO, can potentially lead to the lack of or much weaker variability in tropical and extratropical composition of the UTLS.
A more realistic representation of the spectrum of variability in climate models will provide a better estimate of future projections. Thus, this study emphasizes the crucial need to continue collecting and evaluating high quality satellite measurements to trace the impact of changes in the UTLS circulation.
Data Sources:
Aura MLS version 4.2 Level 2 measurements of temperature (T), ozone (03) and water vapor (H2O) are available from the NASA Goddard Space Flight Center Earth Sciences (GES) Data and Information Services Center (DISC). The MLS data between 250 and 30 hPa are outputted on 12 pressure levels, and the MLS vertical resolution was retained. The MERRA-2 reanalysis of horizontal wind (U and V) fields were obtained from the NASA Earth Observing System Data and Information System (https://earthdata.nasa.gov).
References: Tweedy, O. V., Oman, L. D., & Waugh, D. W. (2020). Seasonality of the MJO impact on upper troposphere/lower stratosphere temperature, circulation and composition. Journal of the Atmospheric Sciences, JAS-D-19-0183.1. https://doi.org/10.1175/JAS-D-19-0183.1
This work was supported by the NASA Postdoctoral Program (NPP) at NASA GSFC
04.2021