Projected increases in drought severity and frequency for this century raise questions regarding possible impacts on air quality. Surface ozone, an air pollutant estimated to cause over 1 million annual premature deaths globally, forms when its precursor gases react in the sunlit atmosphere. These precursor gases depend on temperature and precipitation, especially nitrogen oxide (NOx) from soils and biogenic volatile organic compounds (VOCs) from plants, and thus can respond to drought.
We analyze over a decade of Aura Ozone Monitoring Instrument (OMI) satellite observations of two trace gases, nitrogen dioxide (NO2) and formaldehyde (HCHO) relevant to ozone formation and find that, on average, their concentrations increase during summer droughts in the Eastern US. While higher temperatures during droughts are usually associated with observed increases in trace gas concentrations, in the Southeast US we find increases associated with low precipitation independent of temperature.
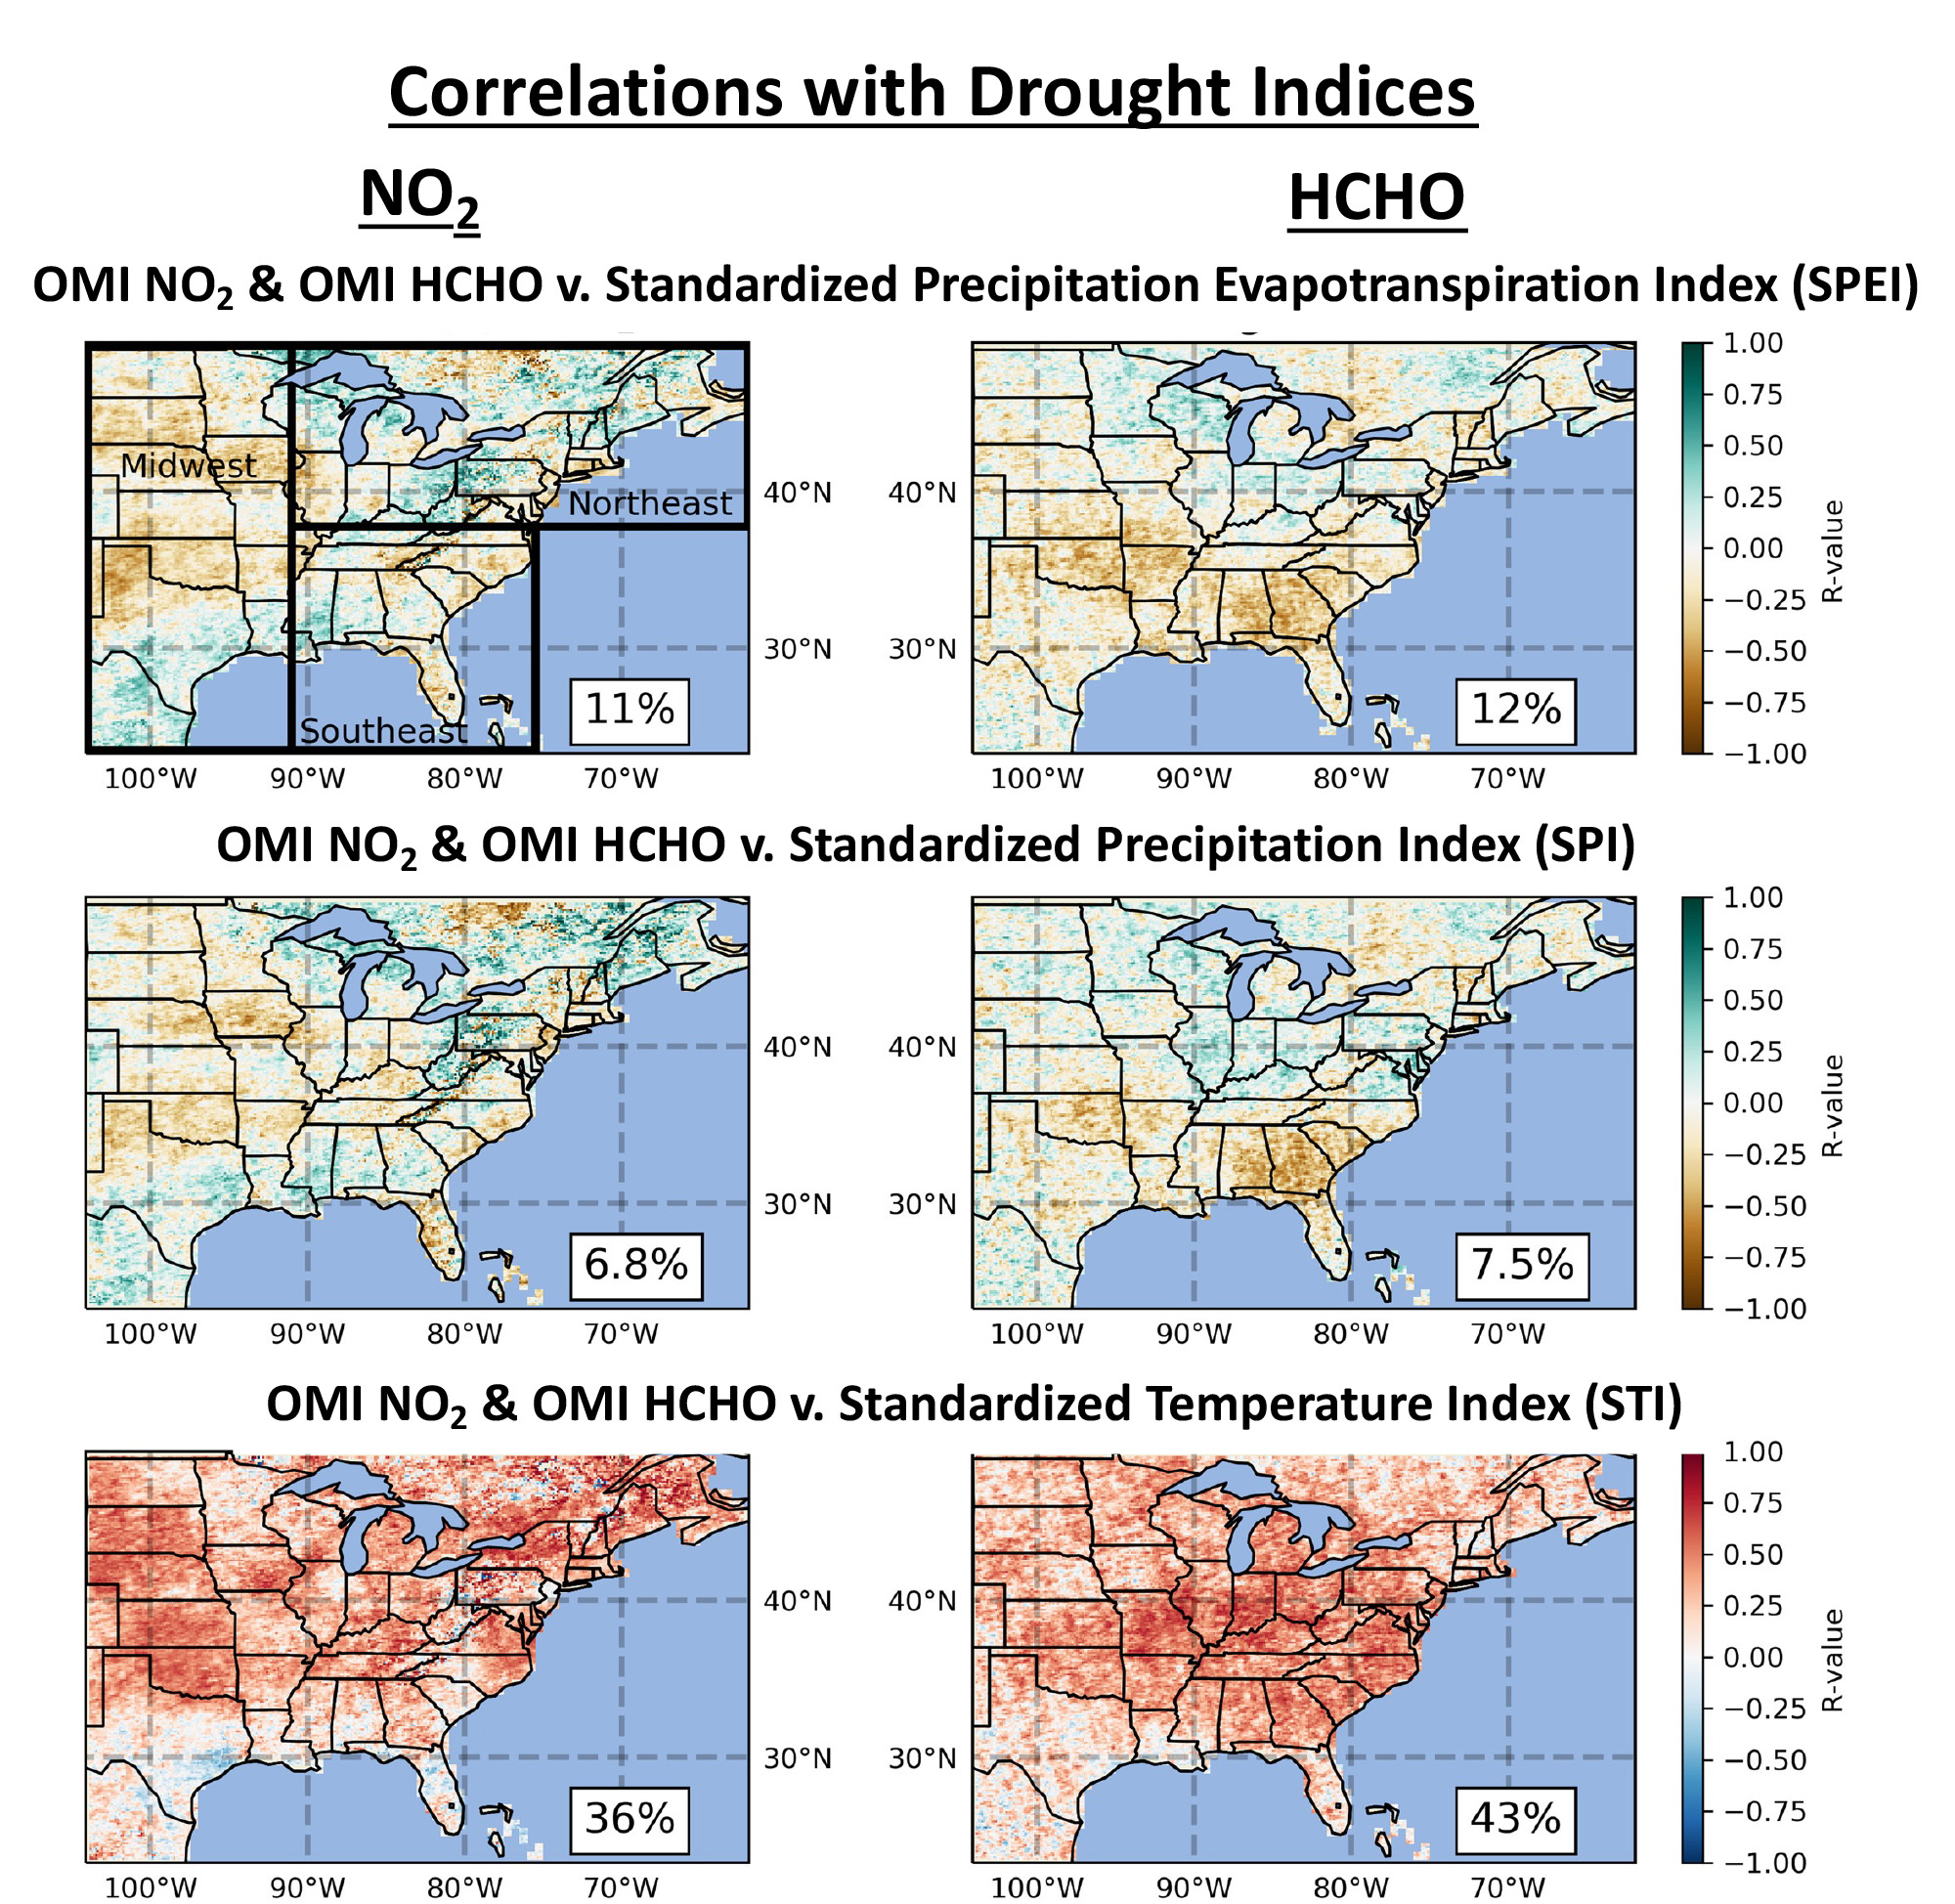
Figure : Ordinary least squares (Pearson) correlation of either ΩNO2 (left) or ΩHCHO (right) monthly anomalies regressed against SPEI (top), SPI (middle), or STI (bottom) climate indices, over the Eastern US during summer (JJA). Note: lower SPEI and SPI values represent drier conditions, while higher STI values represent warmer conditions. SPEI regressions are for 2005–2015, while SPI and STI regressions are for 2005–2016 (ΩHCHO) and 2005–2017 (ΩNO2). Percentage values in the bottom, right corners show the percentage of non-water grid cells in which p < 0.05.
Technical Description of Figure:
Ordinary least squares (Pearson) correlation of either ΩNO2 (left) or ΩHCHO (right) monthly anomalies regressed against SPEI (top), SPI (middle), or STI (bottom) climate indices, over the Eastern US during summer (JJA). Note: lower SPEI and SPI values represent drier conditions, while higher STI values represent warmer conditions. SPEI regressions (top) are for 2005–2015, while SPI (middle) and STI (bottom) regressions are for 2005–2016 (ΩHCHO) and 2005–2017 (ΩNO2). Percentage values in the bottom, right corners show the percentage of non-water grid cells in which p < 0.05.
Scientific significance, societal relevance, and relationships to future missions:
The OMI/Aura satellite detects broad scale enhancements in ΩNO2 and ΩHCHO in the Eastern US that are consistent with a previous analysis of ground-based observations in both sign and magnitude (Wang et al., 2017). NO2 and HCHO drought enhancements are both driven more strongly by high temperatures than by low precipitation. We infer that temperature-driven enhancements reflect known emission responses to temperature that are strengthened during drought in the Eastern US. On finer scales, we find that changes in ΩNO2 and ΩHCHO depend on the land cover type over which drought occurs and the extent to which the drought is P-driven versus T-driven. In the Southeast US, we observe that biogenic VOC emissions from terrestrial vegetation can be enhanced even when water stress is unrelated to the influence of high temperature (Guenther et al., 1993; Ormeño et al., 2007; Pegoraro et al., 2005; Potosnak et al., 2014; Turtola et al., 2003; Zhang & Wang, 2016). We hypothesize that the increase detected in the satellite HCHO product reflects enhanced monoterpene emissions during P-driven drought, with some contribution possible from enhanced isoprene emissions during the onset of drought; this hypothesis could readily be tested with field process studies under drought versus normal conditions.
Data Sources:
Aura Ozone Monitoring Instrument (OMI) nitrogen dioxide (NO2) and formaldehyde HCHO data: We use daily QA4ECV ΩNO2 (available 2005–2017) and ΩHCHO (available 2005–2016) retrievals from OMI/Aura (Boersma et al., 2017; De Smedt et al., 2017; Levelt et al., 2006; Zhu et al., 2017), gridded to 0.125° × 0.125° resolution by calculating the area-weighted average, as described by Jin et al. (2020). We calculate monthly means from daily observations to reduce noise. To eliminate the influence of small sample sizes, we require at least 10 valid daily measurements to calculate monthly means. We compare drought versus normal conditions in June, July, and August.
References:
Naimark, J. G., Fiore, A. M., Jin, X., Wang, Y., Klovenski, E., & Braneon, C. (2021). Evaluating drought responses of surface ozone precursor proxies: Variations with land cover type, precipitation, and temperature. Geophysical Research Letters, 48, e2020GL091520. https://doi.org/10.1029/2020GL0915
10.2021

