Figure : Predicting the effect of confinement on the COVID-19 spread using machine learning enriched with satellite air pollution observations.
Technical Description of Figure:
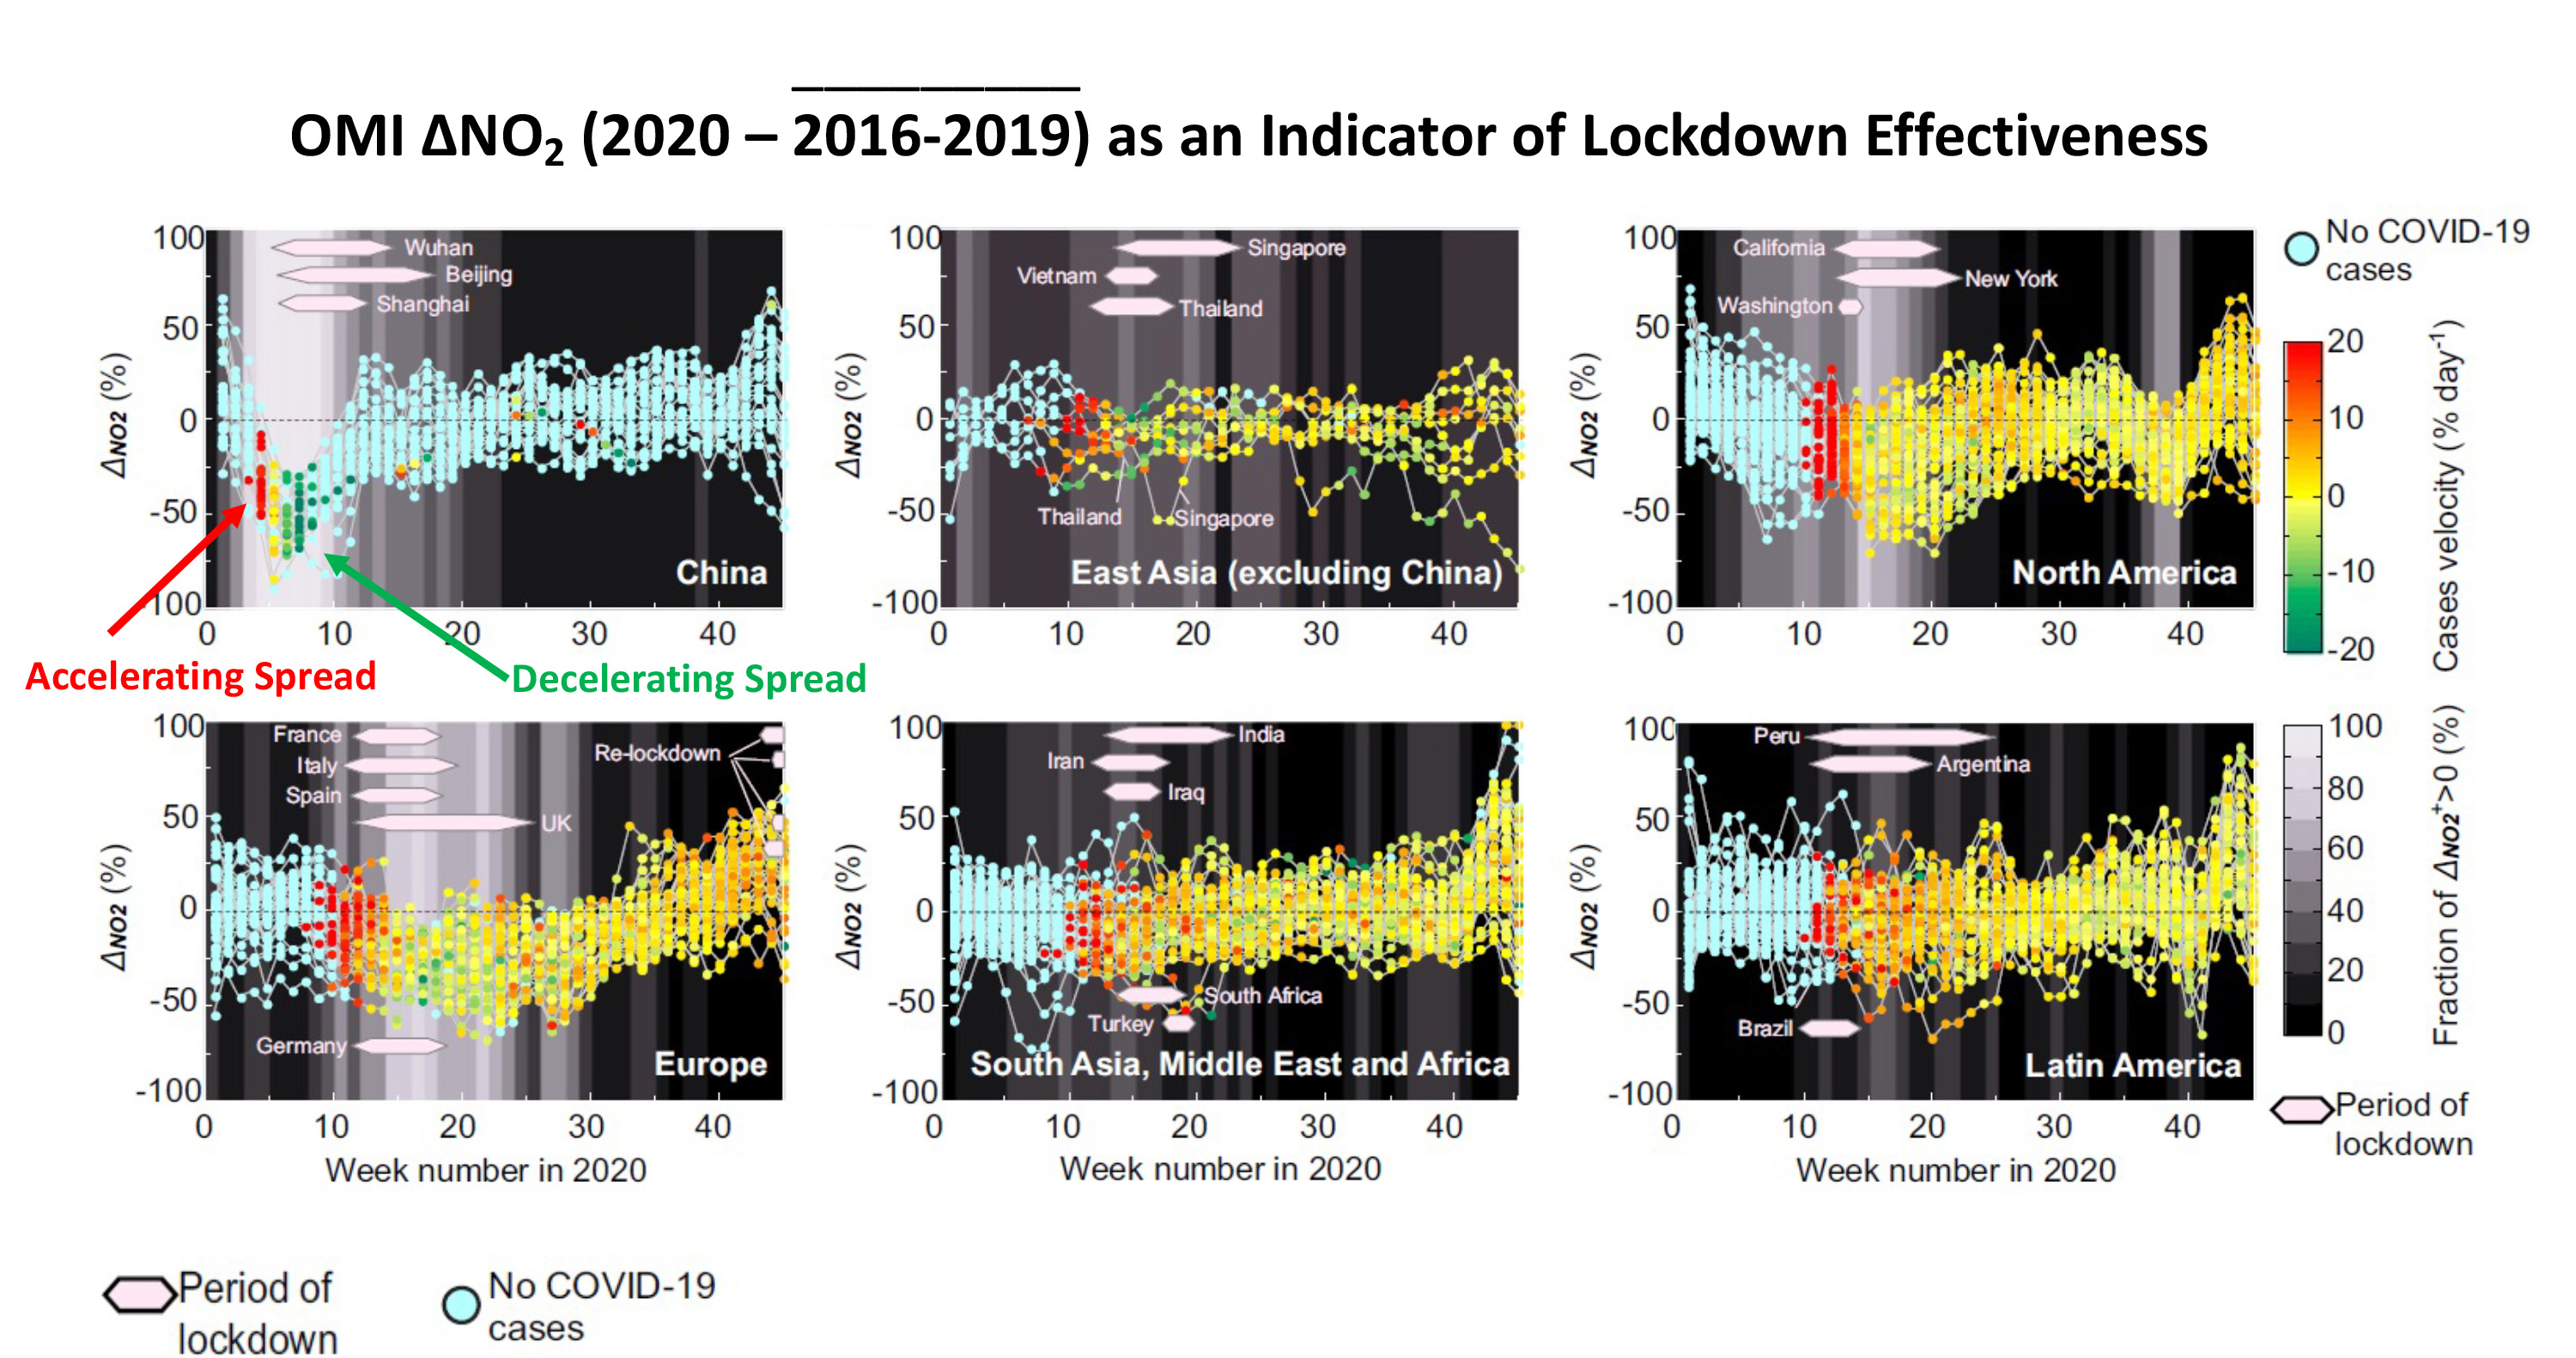
Weekly variations in OMI measured NO2 pollution (ΔNO2, %) as an indicator for activity changes during the COVID-19 pandemic in 2020 relative to the same weeks in 2016 to 2019 from 1 January to 8 November 2020 in 31 provinces in China, 11 East Asian countries excluding China, 51 states in the United States (including the District of Columbia) and Canada, 37 countries in Europe, 57 countries in southern Asia, the Middle East, and Africa, and 23 countries in Latin America. The colorofthe circles evolves from red (COVID cases acceleration) to green (cases deceleration) as the weekly velocity of COVID-19 cases responds to Nonpharmaceutical government interventions (NPIs) before vaccination started. The color of the background evolves from black to white as the fraction of territories with a negative upper bound (mean + SE) ofΔNO2 (ΔNO2 +) increases. The periods of lockdown measures are shown as bars.
Scientific significance, societal relevance, and relationships to future missions:
This study shows how satellite observations of NO2 can provide proxy data for the effectiveness of lockdowns during the COVID-19 pandemic.The authors’ method has three important applications:
Data Sources:
Aura Ozone Monitoring Instrument (OMI) nitrogen dioxide (NO2) data: Daily NO2 data from the OMI product version 3.0 (OMI/Aura NO2 Cloud-126 Screened Total and Tropospheric Column L3 Global Gridded 0.25°×0.25°Version 3), available for 2016 to 2020 are compiled from the Earth Observing System Data in the Information System Distributed Active Archive Centers (https://earthdata.nasa.gov/). The pixel-level data are filtered for clear sky conditions by removing data with a cloud fraction higher than 30%. Daily NO2 below the random noises of the retrieval product (0.45 ×10¹⁵molecules/cm2) are excluded from the analysis to reduce errors in observation at high solar-zenith angles and over snow or ice surfaces.
References:
Xing et al. (2021). Predicting the effect of confinement on the COVID-19 spread using machine learning enriched with satellite air pollution observations. Proceedings of the National Academy of Sciences, 118 (33) e2109098118; DOI: 10.1073/pnas.2109098118
10.2021

