NASA satellite data of atmospheric constituents from NASA’s EOS Terra, Aqua, and Aura may be used to indirectly constrain the spatio-temporal variations of tropospheric OH, the atmosphere’s primary oxidant and dominant methane sink, over broad global regions.
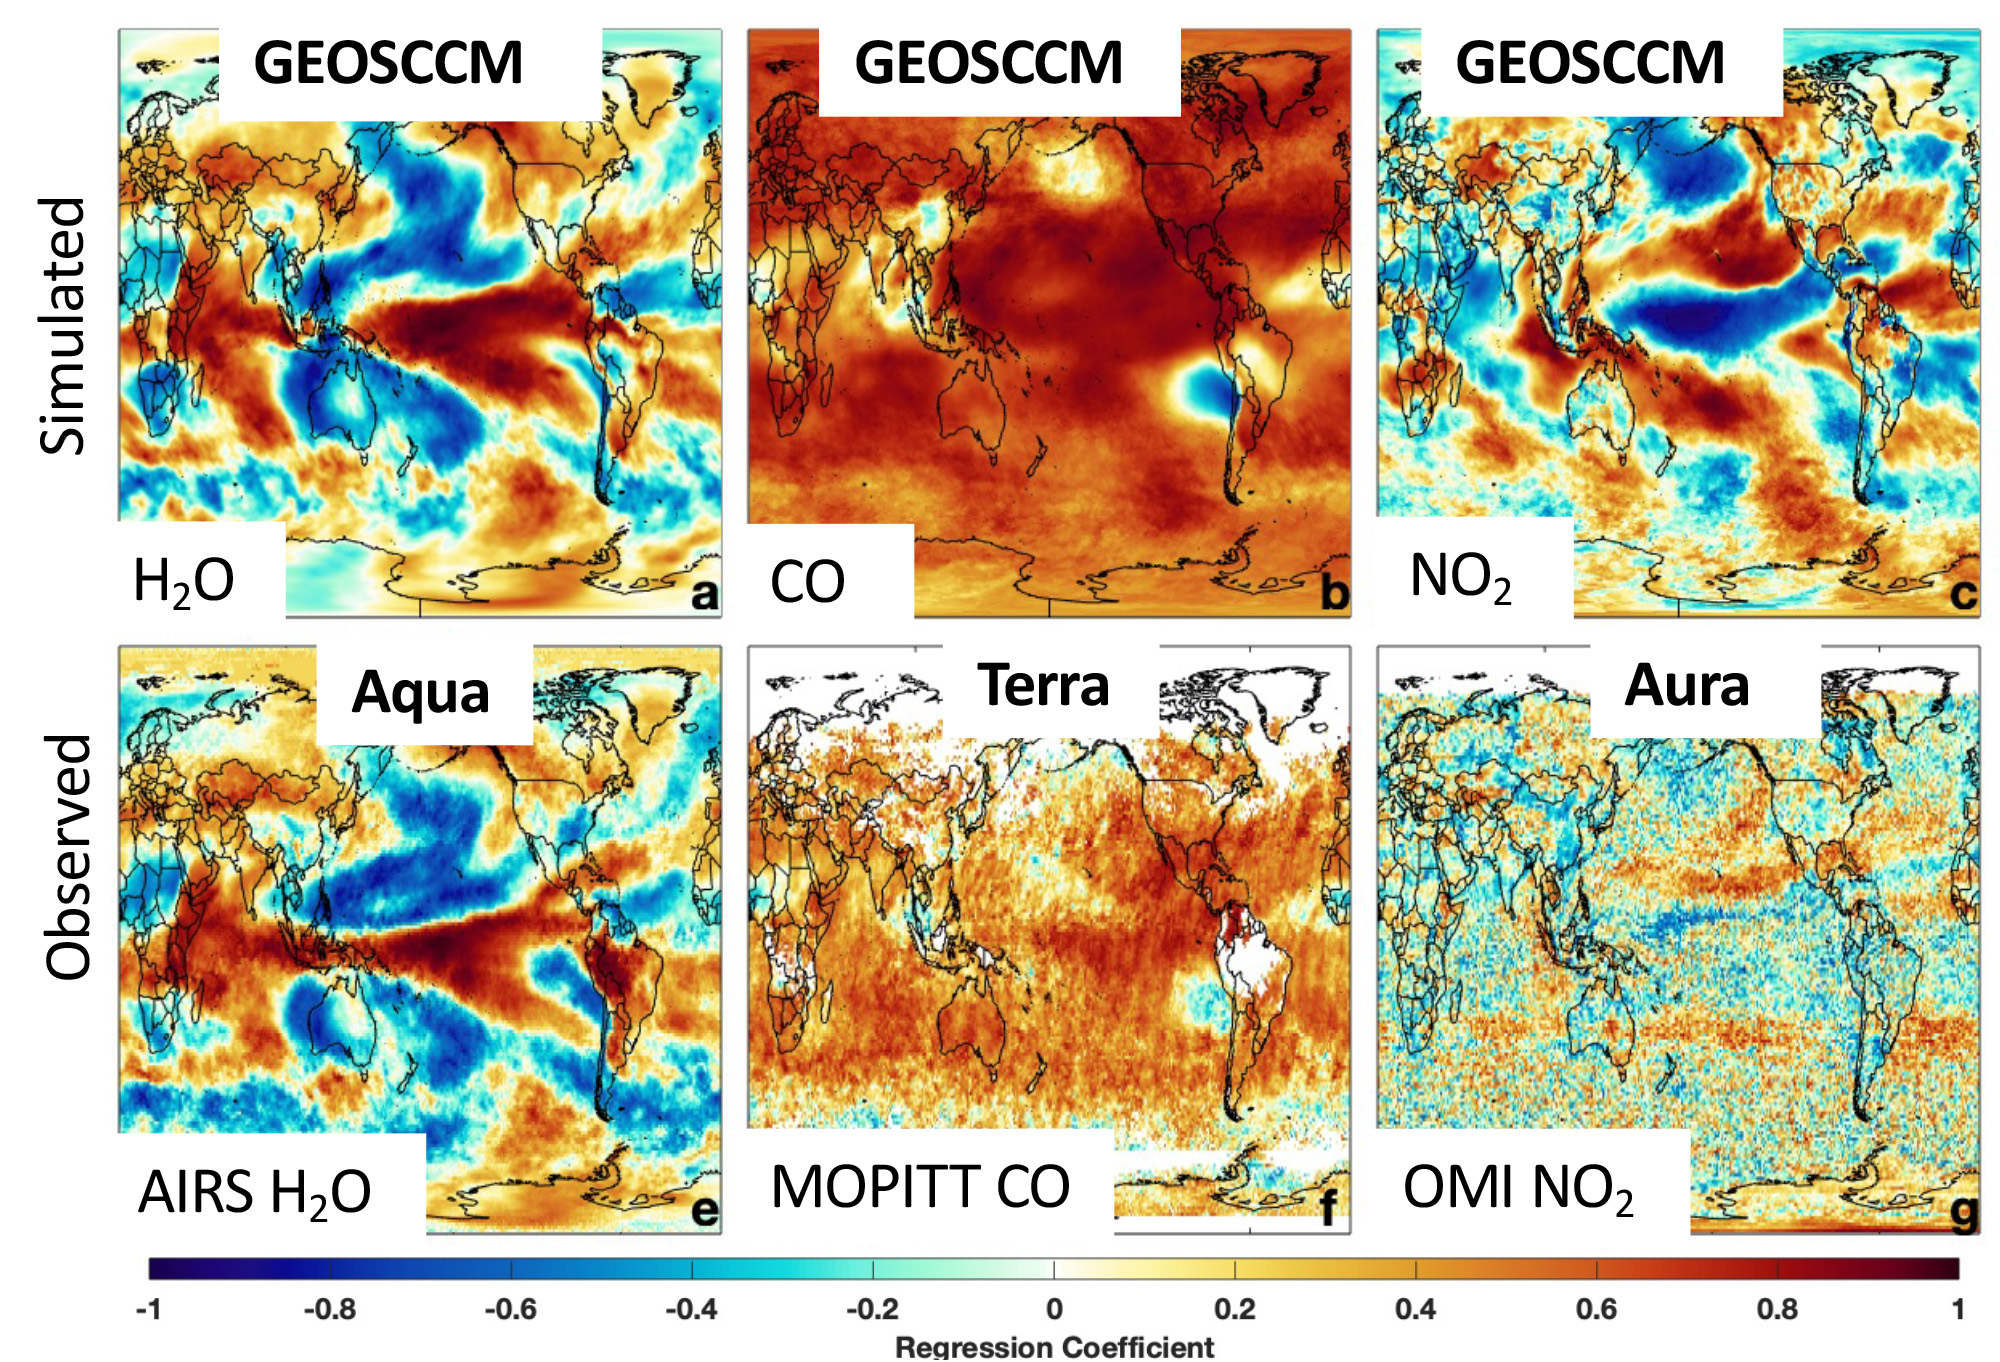
Figure : Spatial and temporal variability in the hydroxyl radical: understanding the role of large-scale climate features and the influence on OH through its dynamical andphoto chemical drivers.
Technical Description of Figure:
The regression coefficient of tropospheric column H2O (left), CO (middle), and NO2 (right) averaged over December – February against the Multivariate ENSO Index (MEI) is shown for the GEOSCCM simulation (top) and for the AIRS, MOPITT, and OMI (bottom) satellite retrievals, respectively. Correlations were performed over the lifetime of the satellites, as outlined above.
Scientific significance, societal relevance, and relationships to future missions:
Tropospheric OH is the dominant sink of CH4, the second-most important anthropogenic greenhouse gas. Understanding spatial and temporal variability of OH is therefore necessary to understand recent trends in methane, whose atmospheric abundance can be controlled both by changes in emissions and changes in sinks. Observations of OH are sparse, however, as it is low in abundance and short-lived. OH has traditionally been constrained on a global and hemispheric basis by observations of methyl chloroform (MCF). Because of recent declines in MCF concentration, which is now at or below instrumental detection limits, alternative constraints on OH are necessary.
Here, based on analysis of the GEOSCCM model, we show that the El Niño Southern Oscillation is the dominant mode of OH variability across all seasons and that satellite retrievals are capable of capturing the ENSO-related variability of OH drivers, including CO, H2O , and NO2. These results provide new constraints on the atmospheric oxidative capacity and interannual variability of OH, necessary for understanding the chemistry of a myriad of species. This work also provides the path forward for a potential new way to constrain OH, and thus the methane lifetime, from space using the approximately 20 years of data from EOS satellites. Because most of the species necessary to constrain OH will also be retrieved from recent and upcoming geostationary satellites (e.g., GEMS and TEMPO), the results here could potentially provide a novel use for these missions.
Data Sources:
For AIRS H2O on the Aqua satellite, we use the monthly averaged, Level 3, Version 6 standard physical retrieval of tropospheric column H2O (Susskind et al., 2014) from 2003 to 2018. For MOPITT CO on the Terra satellite, we use the Level 3, V008 retrieval that uses both near and thermal infrared radiances (Deeter et al., 2019) from 2001 to 2018. Both satellite products have a global horizontal resolution of 1° × 1°. We also use the OMI NO2 Version 4, Level 3 product (Lamsal et al., 2021) from 2005 to 2018. Data have been regridded to 1° × 1° horizontal resolution. OMI is located on the Aura satellite. Data for all three retrievals are available at https://disc.gsfc.nasa.gov. Model output is from a simulation of the NASA GEOSCCM model (Strode et al., 2019) run in replay mode (Orbe et al, 2017) with MERRA2 meteorology (Gelaro et al, 2017) and the GMI chemical mechanism (Duncan et al., 2007). The model was run at a horizontal resolution of 0.625° longitude × 0.5° latitude with 72 vertical levels from 1980 to 2018. The simulation is available at https://acd-ext.gsfc.nasa.gov/Projects/GEOSCCM/MERRA2GMI/. Model output is for the satellite overpass time and has been regridded to a 1° × 1° horizontal resolution.
References:
Anderson et al. (2021). Spatial and temporal variability in the hydroxyl radical: understanding the role of large-scale climate features and their influence on OH through its dynamical and photochemical drivers. Atmospheric Chemistry and Physics, 21, 6481-6508. https://doi.org/10.5194/acp-21-6481-2021.
10.2021

