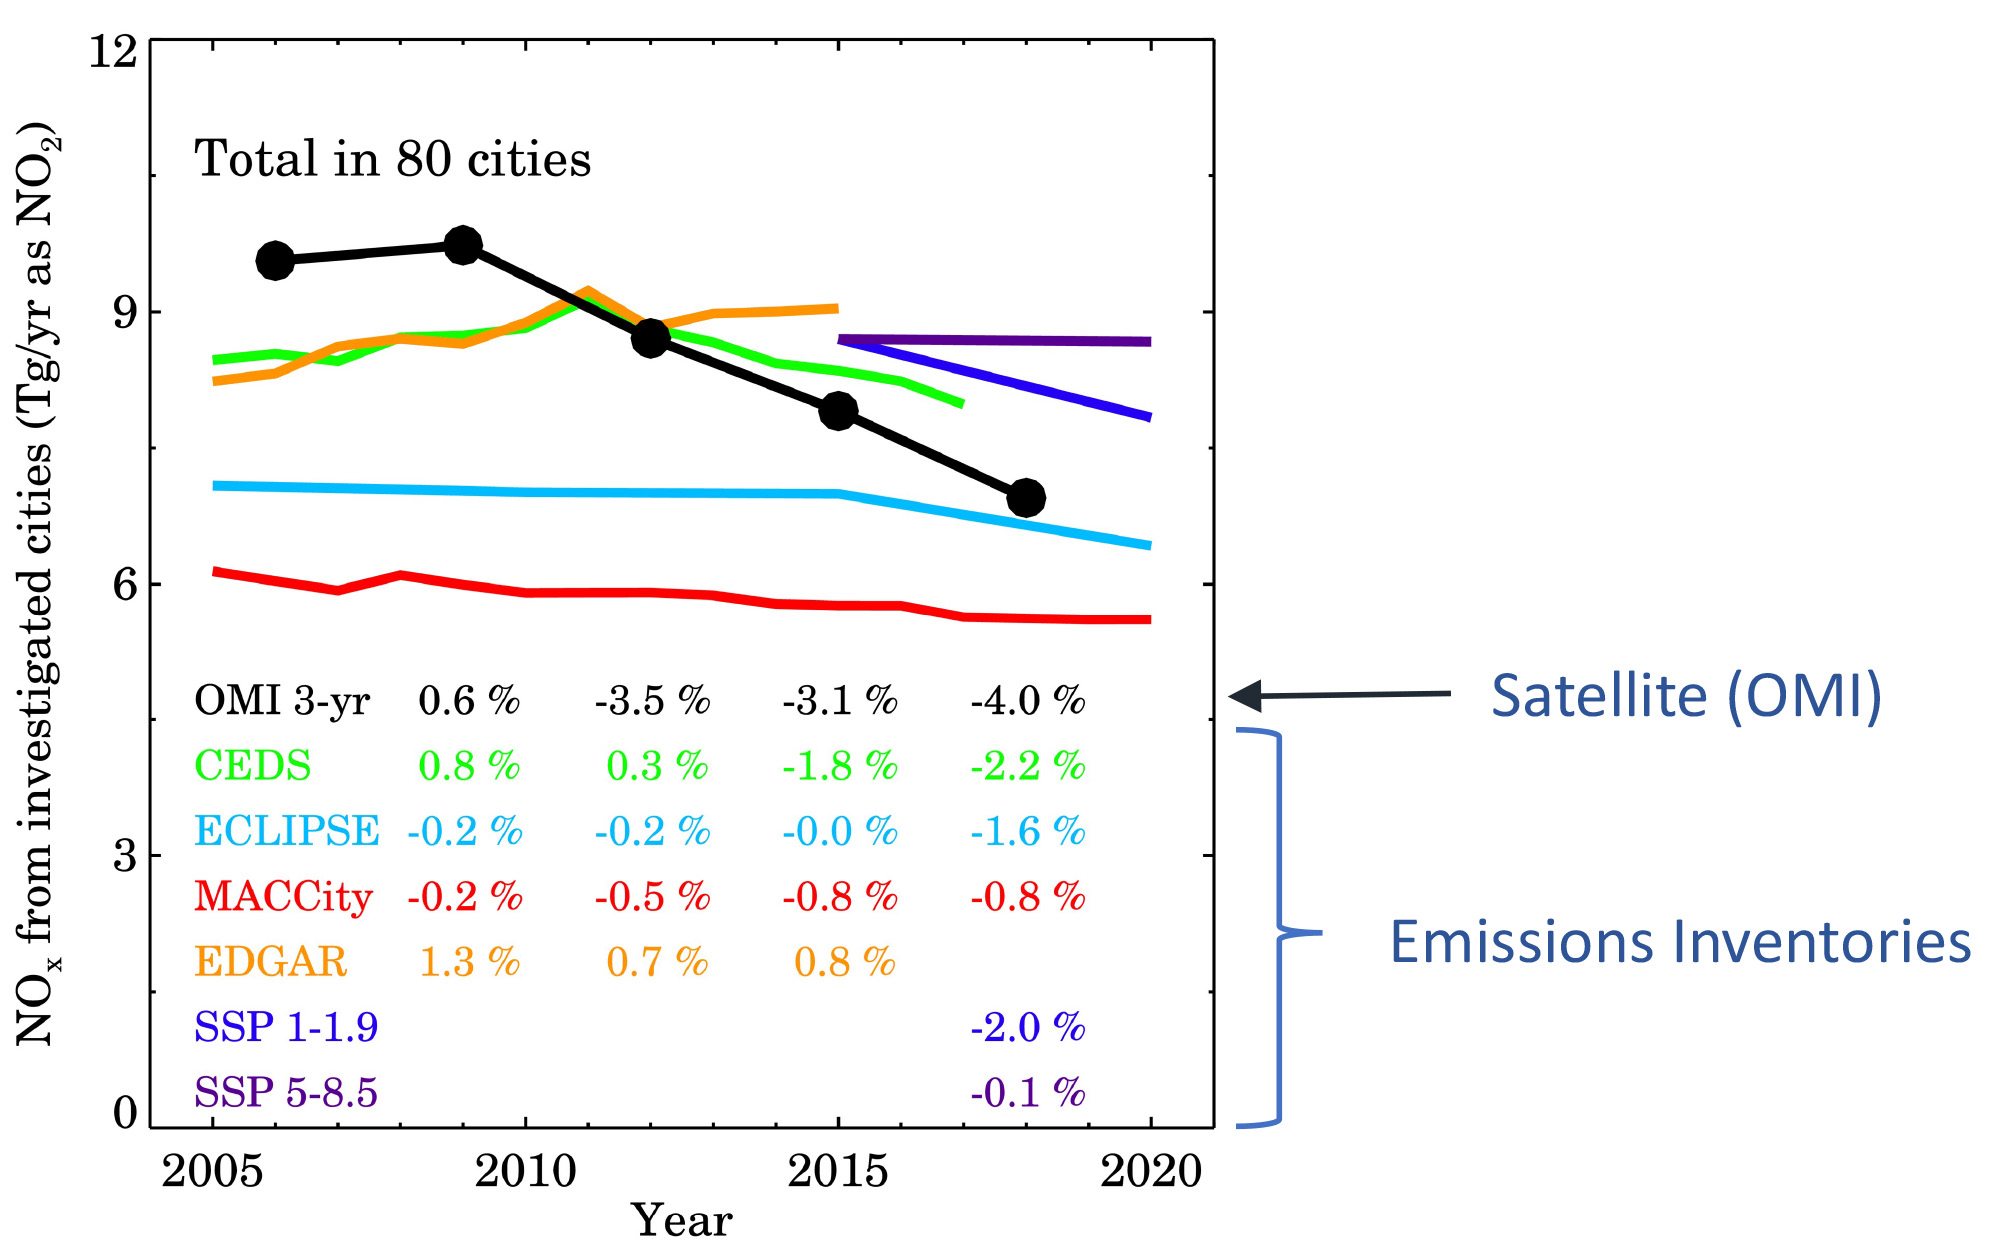
Figure 1: OMI-derived global urban NO2 emissions in 80 cities dropped 3.1 – 4.0% yr-1 between 2009 – 2018, while bottom-up emission inventories show a 0 – 2.2% yr-1 drop over the same timeframe.

Figure 2 : Differences between NOx emissions estimates derived from the Aura Ozone Monitoring Instrument (OMI) NO2 data and the bottom-up inventories are primarily driven by cities in Low-Moderate Income Countries (LMIC), including in Africa, China, India, Latin America, and the Middle East, where uncertainties in bottom-up emission estimates are high. Agreement between satellite-derived trends and the inventories, where uncertainties are relatively low, are generally consistent for High-Income Countries (HIC; e.g., US, Canada, Europe).
Technical Description of Figure(s):
Figure 1: Urban NOx emission trends aggregated for 80 global megacities as derived from OMI NO2 and compared to six different global bottom-up emissions inventories. Satellite-derived (OMI) global urban NOx emissions in all 80 cities dropped 3.1 – 4.0% yr-1 between 2009 – 2018, while inventories show a 0 – 2.2% yr-1 drop over the same timeframe. Some of the discrepancies might be related to the assumptions made to compare the satellite with the inventory, such as the spatial disaggregation of inventories.
Figure 2: Same 80 cities aggregated by region. Differences between satellite-derived estimates and inventories are driven by cities in Africa, China, India, Latin America, and the Middle East. While NOx emission magnitudes were shown, satellite-derived trends are more robust than the satellite-derived magnitudes. The three largest uncertainties in the satellite estimate are the tropospheric column measurements, wind speed/direction, and quantifying the spatial extent of each city.
Scientific significance, societal relevance, and relationships to future missions:
Goldberg et al. (2021) found that urban trends (2009-2018) in NOx emissions as derived from Aura OMI NO2 data agree well with trends from bottom-up inventories in High-Income Countries (HIC), where uncertainties in bottom-up inventories are relatively low. However, they found that urban trends in Low-Moderate Income Countries (LMIC) showed much large disagreement between the OMI-derived trends and the trends from the bottom-up inventories. Given the relatively high agreement between the trends in the HIC, the satellite-derived trends in the LMIC likely provide better constraints in these regions, which have no or less reliable data on NOx emission sources in most LMIC, than many of the bottom-up inventories.
Data Sources:
Aura Ozone Monitoring Instrument (OMI) nitrogen dioxide (NO2) version 4: Lamsal, L. N., et al.: Ozone Monitoring Instrument (OMI) Aura nitrogen dioxide standard product version 4.0 with improved surface and cloud treatments, Atmos. Meas. Tech., 14, 455–479, https://doi.org/10.5194/amt-14-455-2021, 2021.
References:
Goldberg, D. L., Anenberg, S. C., Lu, Z., Streets, D. G., Lamsal, L., McDuffie, E. and Smith, S.: Urban NOx emissions around the world declined faster than anticipated between 2005 and 2019, Environ. Res. Lett., doi:10.1088/1748-9326/AC2C34, 2021
10.2021

