The figure shows observed and modeled LS ozone column trends in the tropics and at northern mid-latitudes for 1998 through 2018. The model runs are from 18 chemistry climate models, with a total of 31 separate simulations. The satellite observations are based on two similar records of merged ozone profiles.
No model reproduces the broad observed pattern (not shown here) of negative LS O3trends from 50ᵒS to 50ᵒN.
About 40% of the simulations lead to significant negative trends in the tropics, but with generally positive trends at northern mid-latitudes.
Variability plays a big role in the large range of model results for such (fairly short-term) trends; mid-latitudes are affected by various transport and mixing effects.
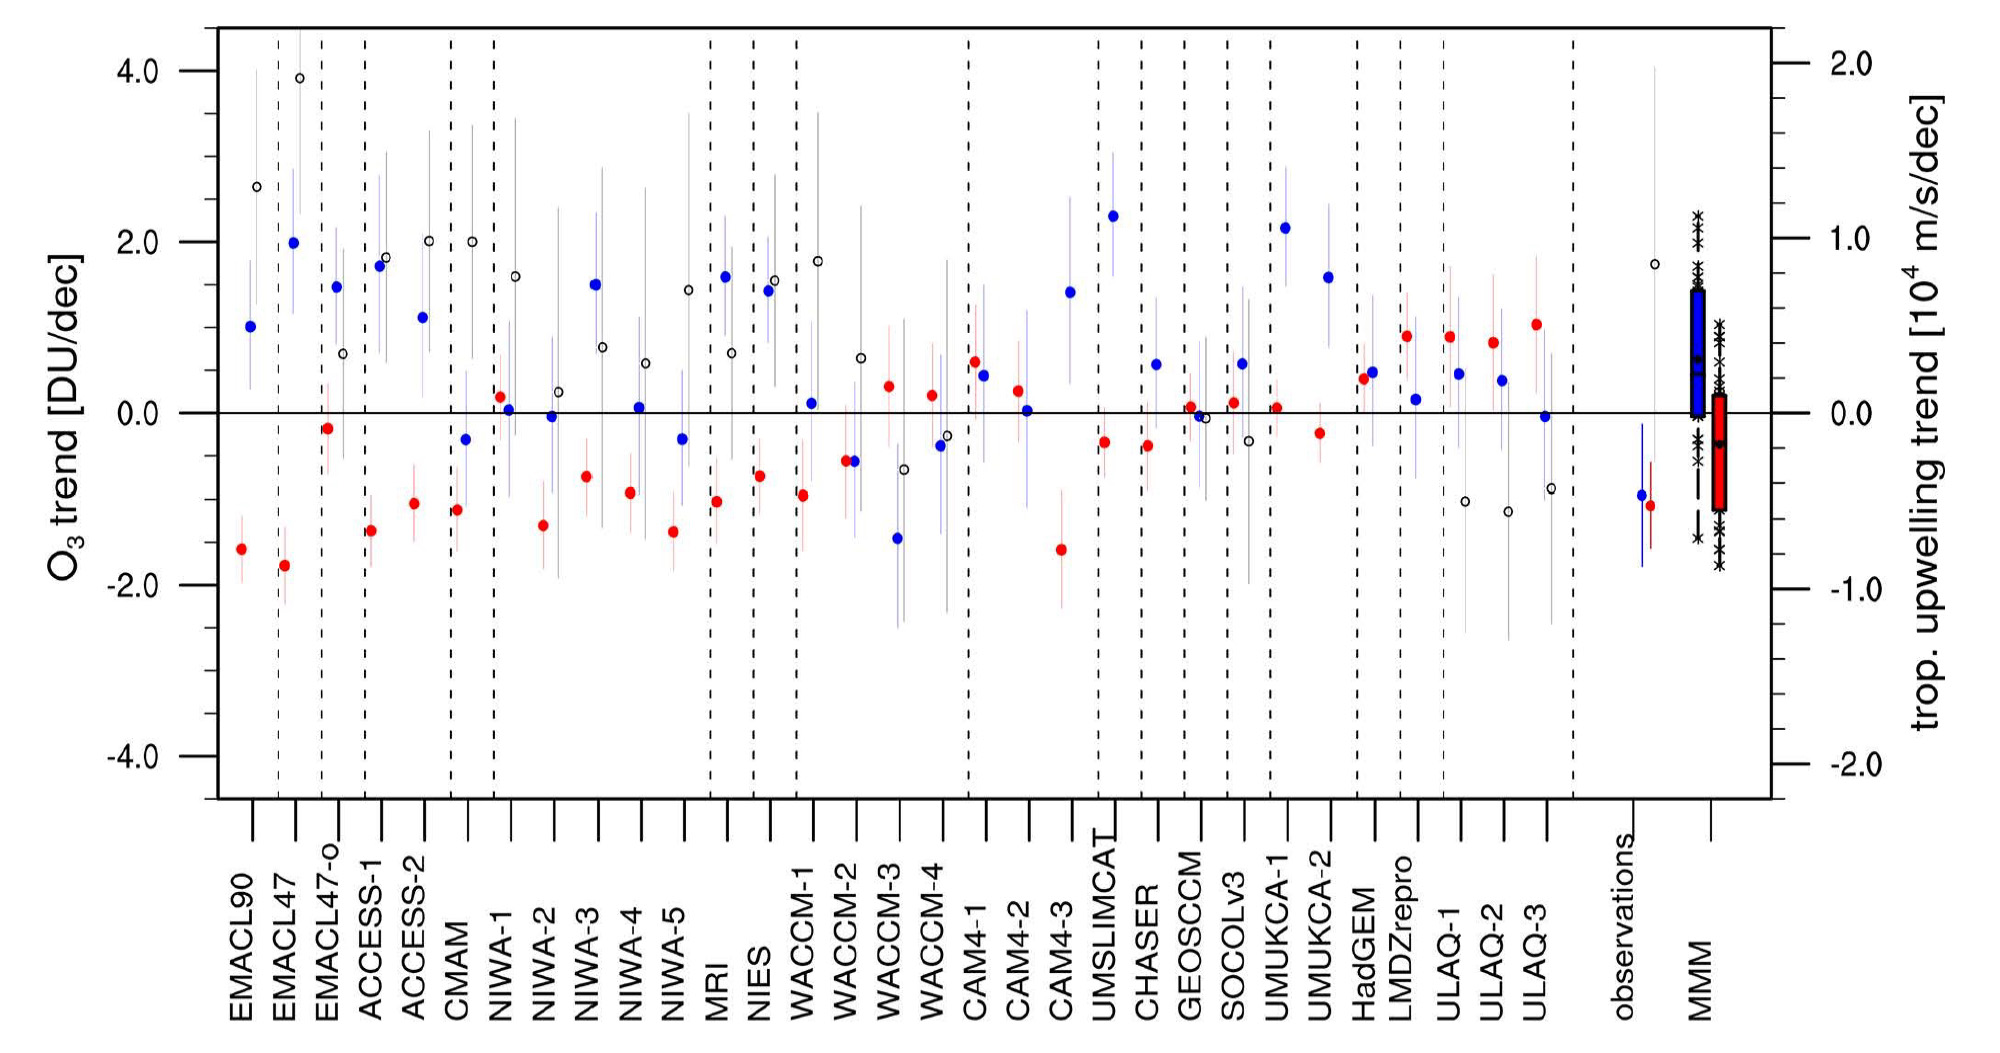
Lower stratospheric ozone trends (for 1998–2018) and their uncertainties in the tropics (20ᵒN–20ᵒS, red dots) and northern mid-latitudes (30ᵒN–50ᵒN, blue dots) based on 31 free-running model simulations (together with tropical upwelling trends, black circles, when available). Dashed lines separate the 18 individual models. Observational trends are given on the right by the two dots (red and blue) with error bars. The red and blue boxes (with 25th & 75th percentiles as boundaries) are the multi-model mean trends.
Technical Description of Figure(s):
LS ozone trends and their uncertainties in the tropics (20ᵒN–20ᵒS; red dots) and northern mid-latitudes (30ᵒN–50ᵒN; blue dots), together with tropical upwelling trend (black circles, for all simulations providing these diagnostics) for the period 1998–2018 for all available free-running (“REF-C2”) simulations. Dashed lines separate the individual models. Observational trends are shown as the red and blue dots with error bars (at right). Observational data for ozone are taken from “BASICSG” (a combination of SWOOSH and GOZCARDS time series) and the tropical upwelling results are from ERA5 (ECMWF reanalysis). Error bars associated with each LS ozone trend represent the 90% confidence intervals. The multi-model mean trends are shown as boxplots: the solid black line in the box indicates the median, the black point indicates the MMM, and the colored box ranges from the 25th to the 75th percentile of the trends. Crosses denote trends of individual model simulations not lying within the box.
Scientific significance, societal relevance, and relationships to future missions:
This work is significant for an improved understanding of the variations and trends in stratospheric ozone, which protects the Earth from the harmful effects of solar UV radiation. In terms of future satellite data, there are very few confirmed plans for future missions, such as MLS, with a focus on daily global vertically-resolved composition measurements from the upper troposphere to the upper mesosphere.
Data Sources:
The ozone data records used in this work were produced through combinations of international satellite instrument data merged onto a homogeneous vertical/temporal grid, including data from SAGE (Stratospheric Aerosol and Gases Experiment) and Aura MLS (Microwave Limb Sounder). The SWOOSH (Stratospheric Water and OzOne Satellite Homogenized database) merged ozone data record is available here . The GOZCARDS (Global OZone Chemistry And Related trace gas Data records for the Stratosphere) ozone merged zonal monthly mean data (version 2.20) are available by contacting Lucien Froidevaux at JPL; this data version will be updated on the public Goddard Earth Sciences Data and Information Services Center (GES DISC), where the version 1 GOZCARDS data reside. The observational (BASICSG) dataset used in this work is a combination of these two merged data records (analyses by W. Ball et al.); this updated dataset will be available to the public (contact W. Ball for more information). The model runs have been guided by the activities of the Chemistry Climate Model Initiative (CCMI) and model results are generally available from the British Atmospheric Data Centre (BADC).
References:
Dietmüller, S., Garny, H., Eichinger, R., and Ball, W., Atmos. Chem. Phys., 21, 6811–6837, https://doi.org/10.5194/acp-21-6811-2021, 2021.
03.2022

