Stratospheric water vapor (SWV) is a strong greenhouse gas; thus accurate quantification of changes in the SWV budget is essential for understanding climate change. Climate models nearly unanimously project future stratospheric moistening. However, robust estimates of global SWV trends over the last several decades have been lacking.
Aura Microwave Limb Sounder (MLS) measurements, in situ frost point hygrometer (FPH) observations from Boulder, and simulations from a Lagrangian (i.e., trajectory-based) model driven by meteorological reanalyses all show substantial and persistent stratospheric moistening following a sharp drop in SWV observed around the year 2000. The largest trends in humidity (∼0.2 ppmv/decade) in the tropical lower stratosphere are seen in boreal late winter / spring, are well-correlated with warming of the cold point tropopause, and can only partially be attributed to ENSO and volcanic eruptions. Substantial hemispheric asymmetry is found, with strong positive trends in the Northern Hemisphere and weak negative trends (i.e., strengthening dehydration) in Antarctica during austral winter. Agreement between MLS-based and model-based SWV trends is good; differences with Boulder/FPH data are larger.
SWV represents an important climate feedback (warmer air holds more moisture, enhancing the greenhouse effect), but its long-term trends have been highly uncertain. The moistening found here is likely related to climate change.
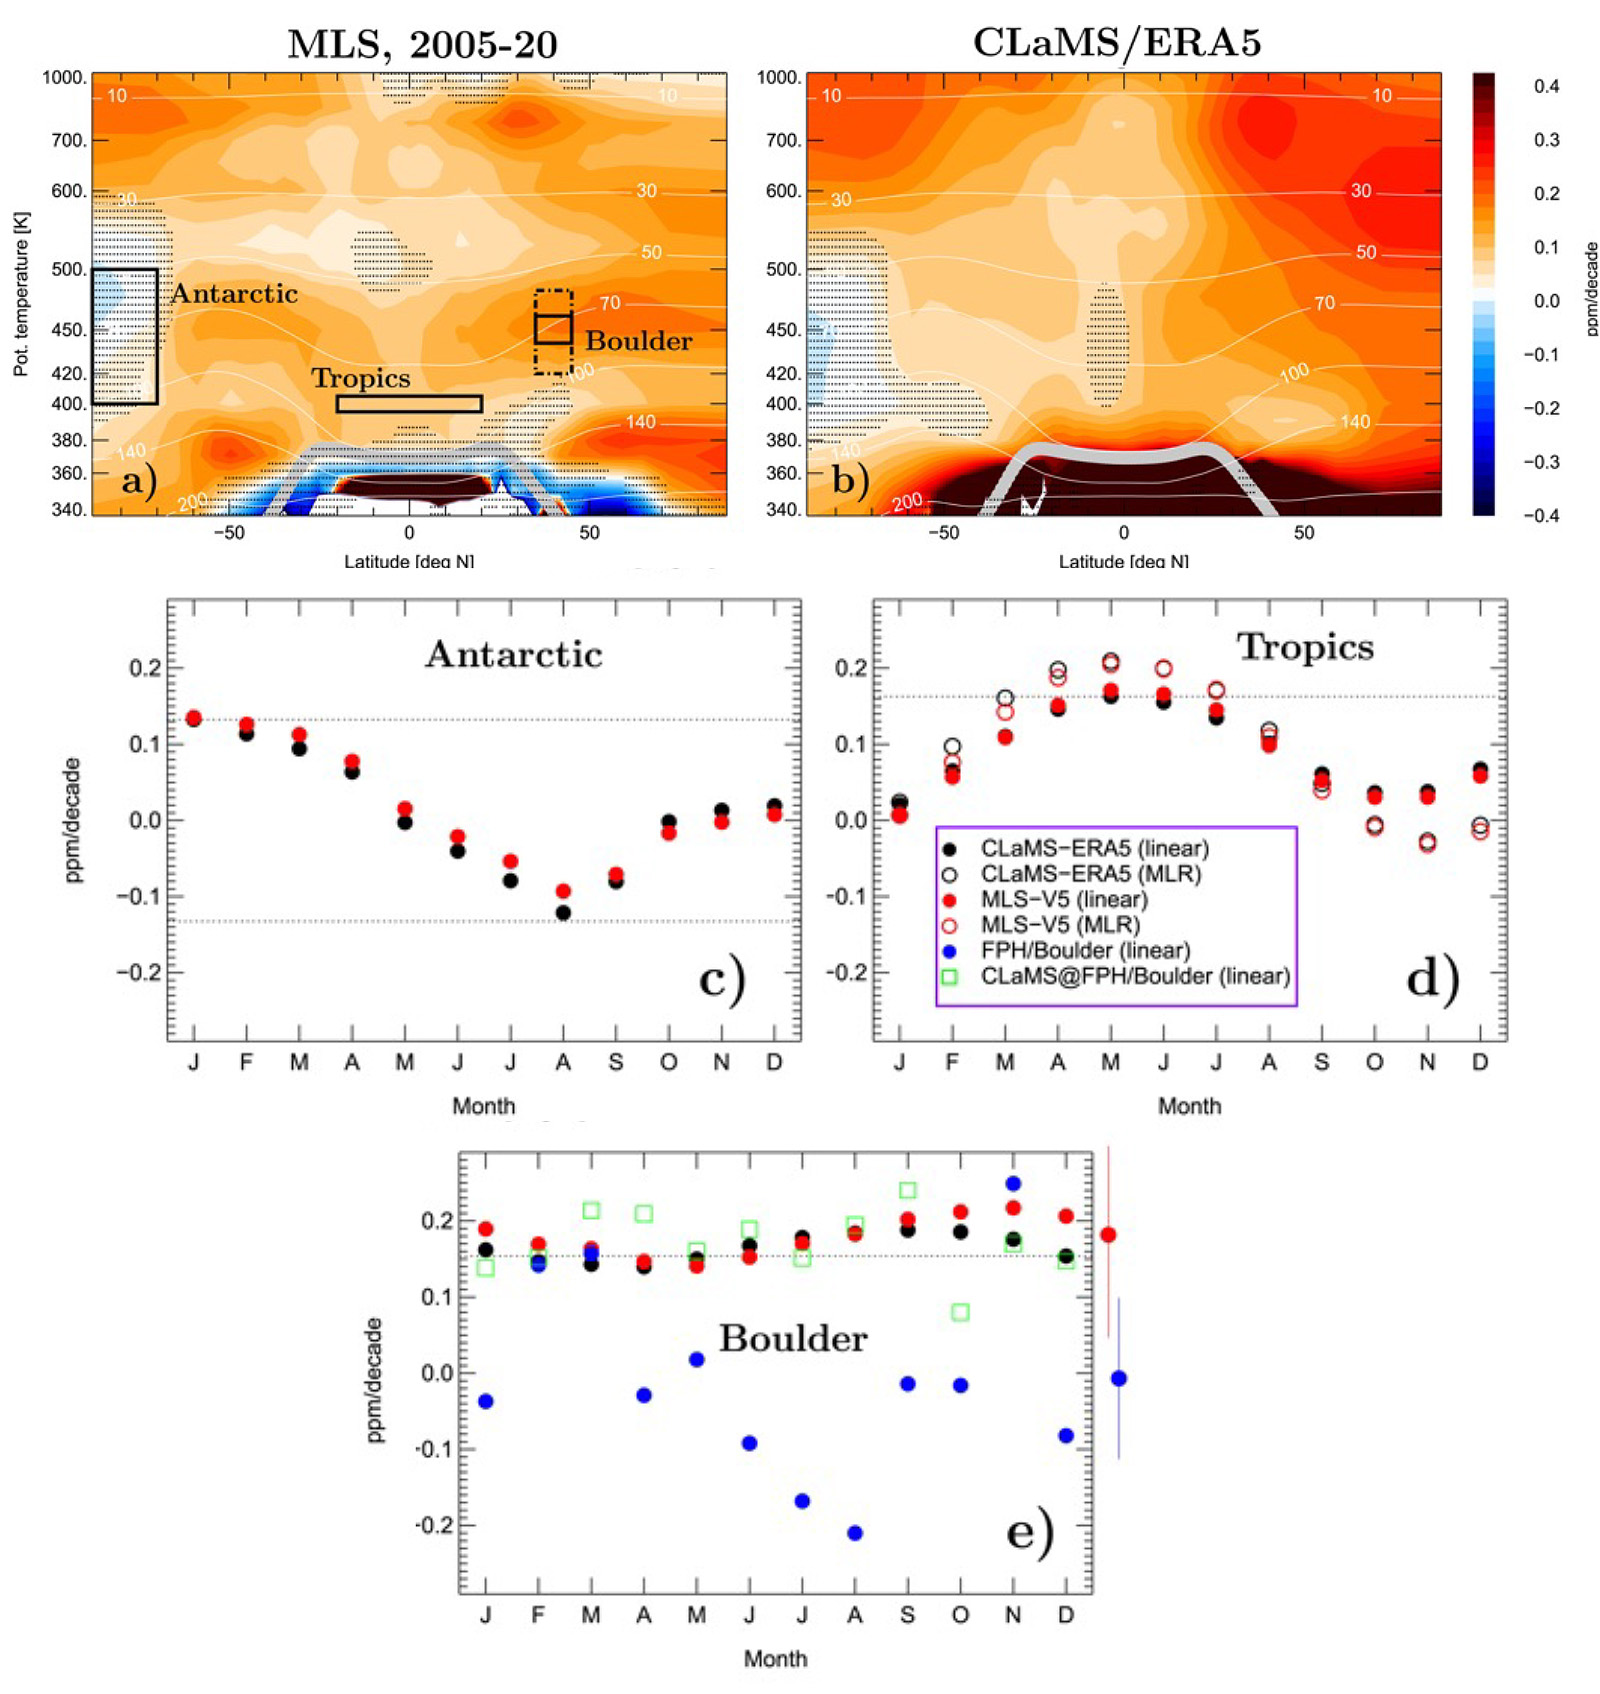
Linear trends in stratospheric water vapor over the 2005–2020 period derived from (a) Microwave Limb Sounder (MLS) and (b) the Chemical Lagrangian Model of the Stratosphere (CLaMS) driven by meteorological reanalyses generally agree well in the stratosphere. Stippling indicates regions where trends are not statistically significant. The middle panels show that the seasonality of the trends from MLS and CLaMS in the Antarctic (c) and the tropics (d) also agree well. The bottom panel (e) shows larger differences with the trends computed from in situ frost point hygrometer (FPH) observations from Boulder.
Data Sources:
Aura MLS data (v5) Boulder/FPH data CLaMS data: Tao et al. (2019), Ploeger et al. (2021) Singapore winds GLoSSAC v2.0 Aerosol extinction coefficient Meteorological reanalyses: ERA5 ERA-Interim
Technical description of figure:
Figure 4 of above reference. Linear trends in stratospheric water vapor derived from (a) Microwave Limb Sounder (MLS) and (b) Chemical Lagrangian Model of the Stratosphere (CLaMS)/ERA5 for the 2005–2020 period. CLaMS/ERA5 output was interpolated to MLS measurement locations with the MLS averaging kernel applied. The climatological tropopause is marked by the thick grey line. Results not reaching the level of statistical significance are dot-hatched. (c)-(e) The seasonality of the trends for selected regions (defined as shown by the black rectangles overlaid in (a)). Black symbols show CLaMS/ERA5, red show MLS, and blue show Boulder/FPH data. Filled circles depict linear trends; open ones are results from applying a multiple linear regression considering the quasi-biennial oscillation, ENSO, volcanic eruptions, and aerosol optical depth. Green open squares in (e) denote the seasonality of CLaMS/ERA5 results interpolated to the Boulder/FPH measurement locations. CLaMS/ERA5 and MLS trend values outside of the dotted black lines are statistically significant. The mean 2σ errors of the Boulder monthly trends and of the respective MLS trends are shown on the right side of panel (e) as blue and red error bars. With an average of 21 Boulder/FPH data points per monthly trend analysis, those trends have large uncertainties. In general, the MLS-based and the CLaMS/ERA5-based linear SWV trends and their seasonality agree well; differences with Boulder/FPH data are larger.
Scientific significance, societal relevance, and relationships to future missions:
Stratospheric water vapor (SWV) plays a significant role in the positive feedback of global climate warming, with a radiative forcing of ∼0.25 W m-2 for each 1 ppm increase. Data limitations have precluded robust estimates of the long-term global (i.e., as a function of altitude and latitude) trends in SWV. This study reconstructed SWV variability over the last 42 years using a Lagrangian model (CLaMS) driven by the latest ECMWF reanalyses (ERA5) and found statistically significant moistening of the stratosphere since the well-documented sudden drop in SWV in 2000. Very good agreement with MLS and fairly good agreement with Boulder/FPH measurements lend confidence in the model/reanalysis results. With the improved reliability of modern meteorological reanalyses, their importance and applicability for climate monitoring will grow, especially in light of the impending cessation of the high-quality long-term Aura MLS SWV record. MLS is the only sensor providing daily near-global profiles of humidity from the upper troposphere to the mesosphere. The sole confirmed future sensor, ALTIUS (ESA), will measure water vapor only in solar occultation, giving only ∼monthly global coverage.
Reference:
Konopka, P., M. Tao, F. Ploeger, D.F. Hurst, M.L. Santee, J.S. Wright, & M. Riese. (2022). Stratospheric moistening after 2000, Geophys. Res. Lett., 49, e2021GL097609. https://doi.org/10.1029/2021GL097609
10.2022

