What are the trends in stratospheric chlorine species over the past decade and a half, and do they follow expectations, based on decreases in total surface chlorine since the turn of the century?
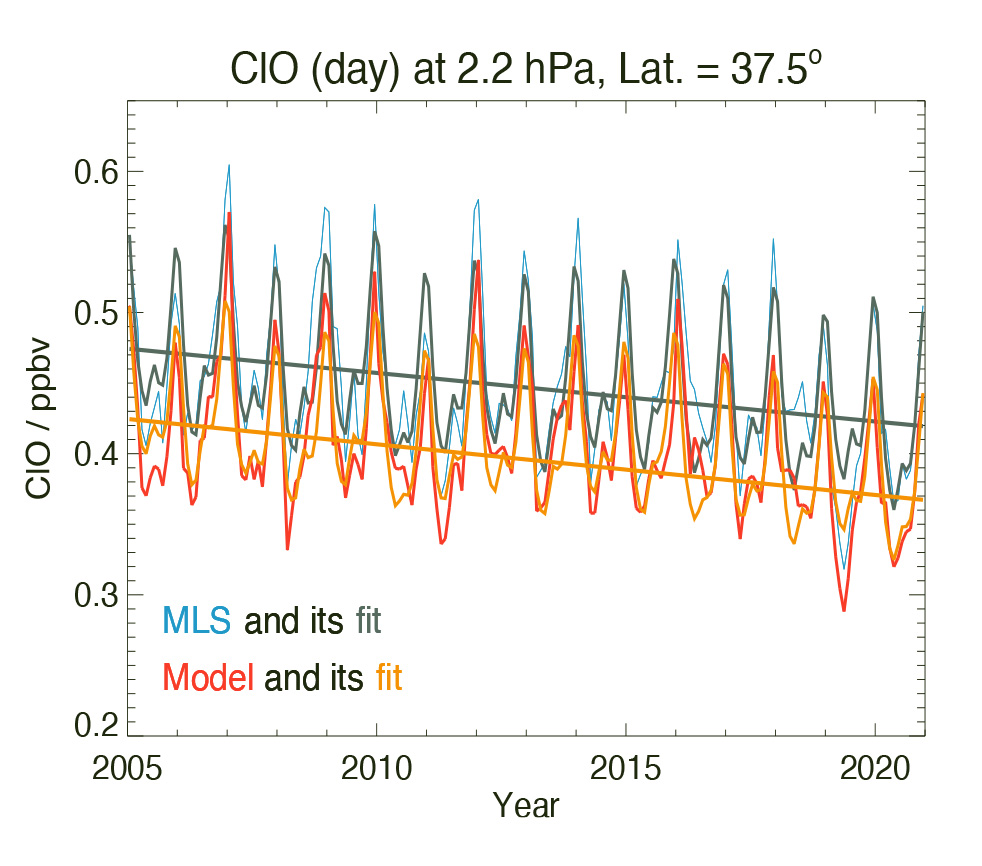
Fig. 1. Monthly zonal mean time series of ClO volume mixing ratios (ppbv) over 2005–2020 at 37.5ᴼN (±2.5ᴼ) and 2.2 hPa (near 42 km altitude). This shows MLS and model results, along with regression fits and linear decreases (fitted lines).
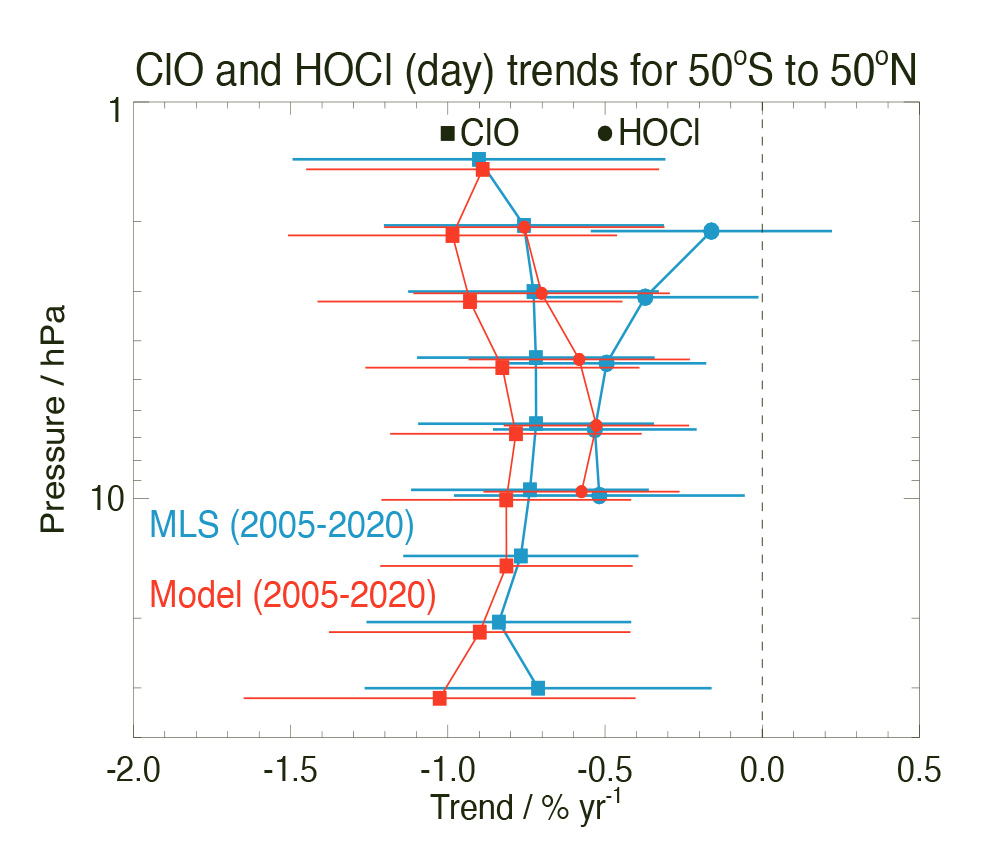
Fig. 2. Derived upper stratospheric trends in ClO (filled squares) and HOCl (filled circles) based on regression fits to daytime monthly zonal mean time series from 50ᴼS to 50ᴼN over the 2005–2020 period. MLS & model results are shown.
This work examines trends in upper stratospheric chlorine species for 2005–2020, with an emphasis on chlorine monoxide (ClO) and hypochlorous acid (HOCl), measured by the Microwave Limb Sounder (MLS) on the Aura satellite. Results are compared to those from a state-of-the-art atmospheric model (WACCM, the Whole Atmosphere Chemistry Climate Model), constrained by the chlorine source gases (and other surface gases) and driven by meteorological fields.
Multiple regression fits are applied to the monthly zonal mean time series, and decreasing linear trends are extracted from both MLS and model time series (see example in Fig. 1). Averaged (50ᴼS–50ᴼN) results (Fig. 2) show MLS and model ClO trends of about -0.8%/year for ClO and -0.5%/year for HOCl. Trends in related upper stratospheric species (e.g., increases in methane) are also analyzed in this paper, to help explain differences between the ClO and HOCl trends.
The 1987 Montreal Protocol and its amendments have led to global chlorine decreases in the stratosphere, where Earth’s protective ozone layer resides. These agreements have strongly limited the deleterious effects of chlorine (and bromine) source gases in terms of potential solar UV increases at the surface.
Data Sources:
The Aura MLS data files used here are available from the NASA GSFC DISC The model results are available online
Technical Description of Figures:
Fig. 1 (Fig. 2 (a) in the paper): Examples of MLS and model ClO (daytime) monthly zonal mean time series (2005 through 2020) for the 35–40ᴼN latitude bin at 2.2 hPa (near 42 km altitude). The MLS data (blue) are fitted by a regression model (gray), and the model series (red) is fitted by the same type of regression model (orange). The dark gray and orange lines are the linear components of the corresponding fits to the MLS and model curves, respectively.
FIg. 2. (Fig. 10 in the paper): Derived upper stratospheric trends in ClO (filled squares) and HOCl (filled circles) based on regression fits to daytime monthly zonal mean time series for both species, for 50ᴼS to 50ᴼN averages from 2005 through 2020; MLS results are in blue and model results in red.
Scientific significance, societal relevance, and relationships to future missions:
The 1987 Montreal Protocol and its amendments have led to global chlorine decreases in the stratosphere, in accord with expectations. These international agreements have strongly limited the deleterious effects of chlorine (and bromine) source gases in terms of potential stratospheric ozone depletion and related solar UV radiation increases at the surface. ClO, in particular, is of critical importance regarding stratospheric ozone depletion and recovery.
As for the continuation of stratospheric data records of chlorine species from Aura MLS or any other planned sensors, there are currently no concrete plans for future satellite measurements of such species.
Reference:
Froidevaux, L., Douglas E. Kinnison, D. E., Michelle L. Santee, M. L., Millán, L. F., Nathaniel J. Livesey, N. J., Read, W. G., Bardeen, C. G., Orlando, J. J., and Fuller, R. A., Upper stratospheric ClO and HOCl trends (2005–2020): Aura Microwave Limb Sounder and model results , Atmos. Chem. Phys., 22, 4779–4799, :10.5194/acp-22-4779-2022, 2022.
10.2022

