A second assessment of satellite humidity measurements was undertaken by the SPARC project (Stratosphere-troposphere Processes and their role in Climate), taking advantage of additional instruments put into operation since the first assessment. The study quantified the accuracy of H2O measured by spaceborne sensors during 1984–2017.
This highlight focuses on comparisons of upper tropospheric humidity measurements from NASA’s AIRS (Atmospheric InfraRed Sounder) and MLS (Microwave Limb Sounder) instruments.
The 15 satellite instruments considered in the UTH assessment are: AIRS (Aqua), ACE-FTS (SciSat), HALOE (UARS), HIRDLS (Aura), MAESTRO (SciSat), MIPAS (EnviSat), MLS (Aura & UARS), POAM-III (SPOT-4), SAGE-II (ERBE), SAGE-III (Meteor-3M), SCIAMACHY (EnviSat), SMILES (ISS), SMR (Odin), and TES (Aura). The agreement among their H2O measurements is typically 30% in the upper troposphere with an additional 30% variability about the mean bias. The agreement between mapped fields measured by AIRS and MLS is within 10% except at the concentration extremes where MLS reports larger humidity than AIRS in moist cases, and smaller humidity in dry cases.
Accurate knowledge of water vapor is essential for quantifying its response to and feedbacks on climate change.
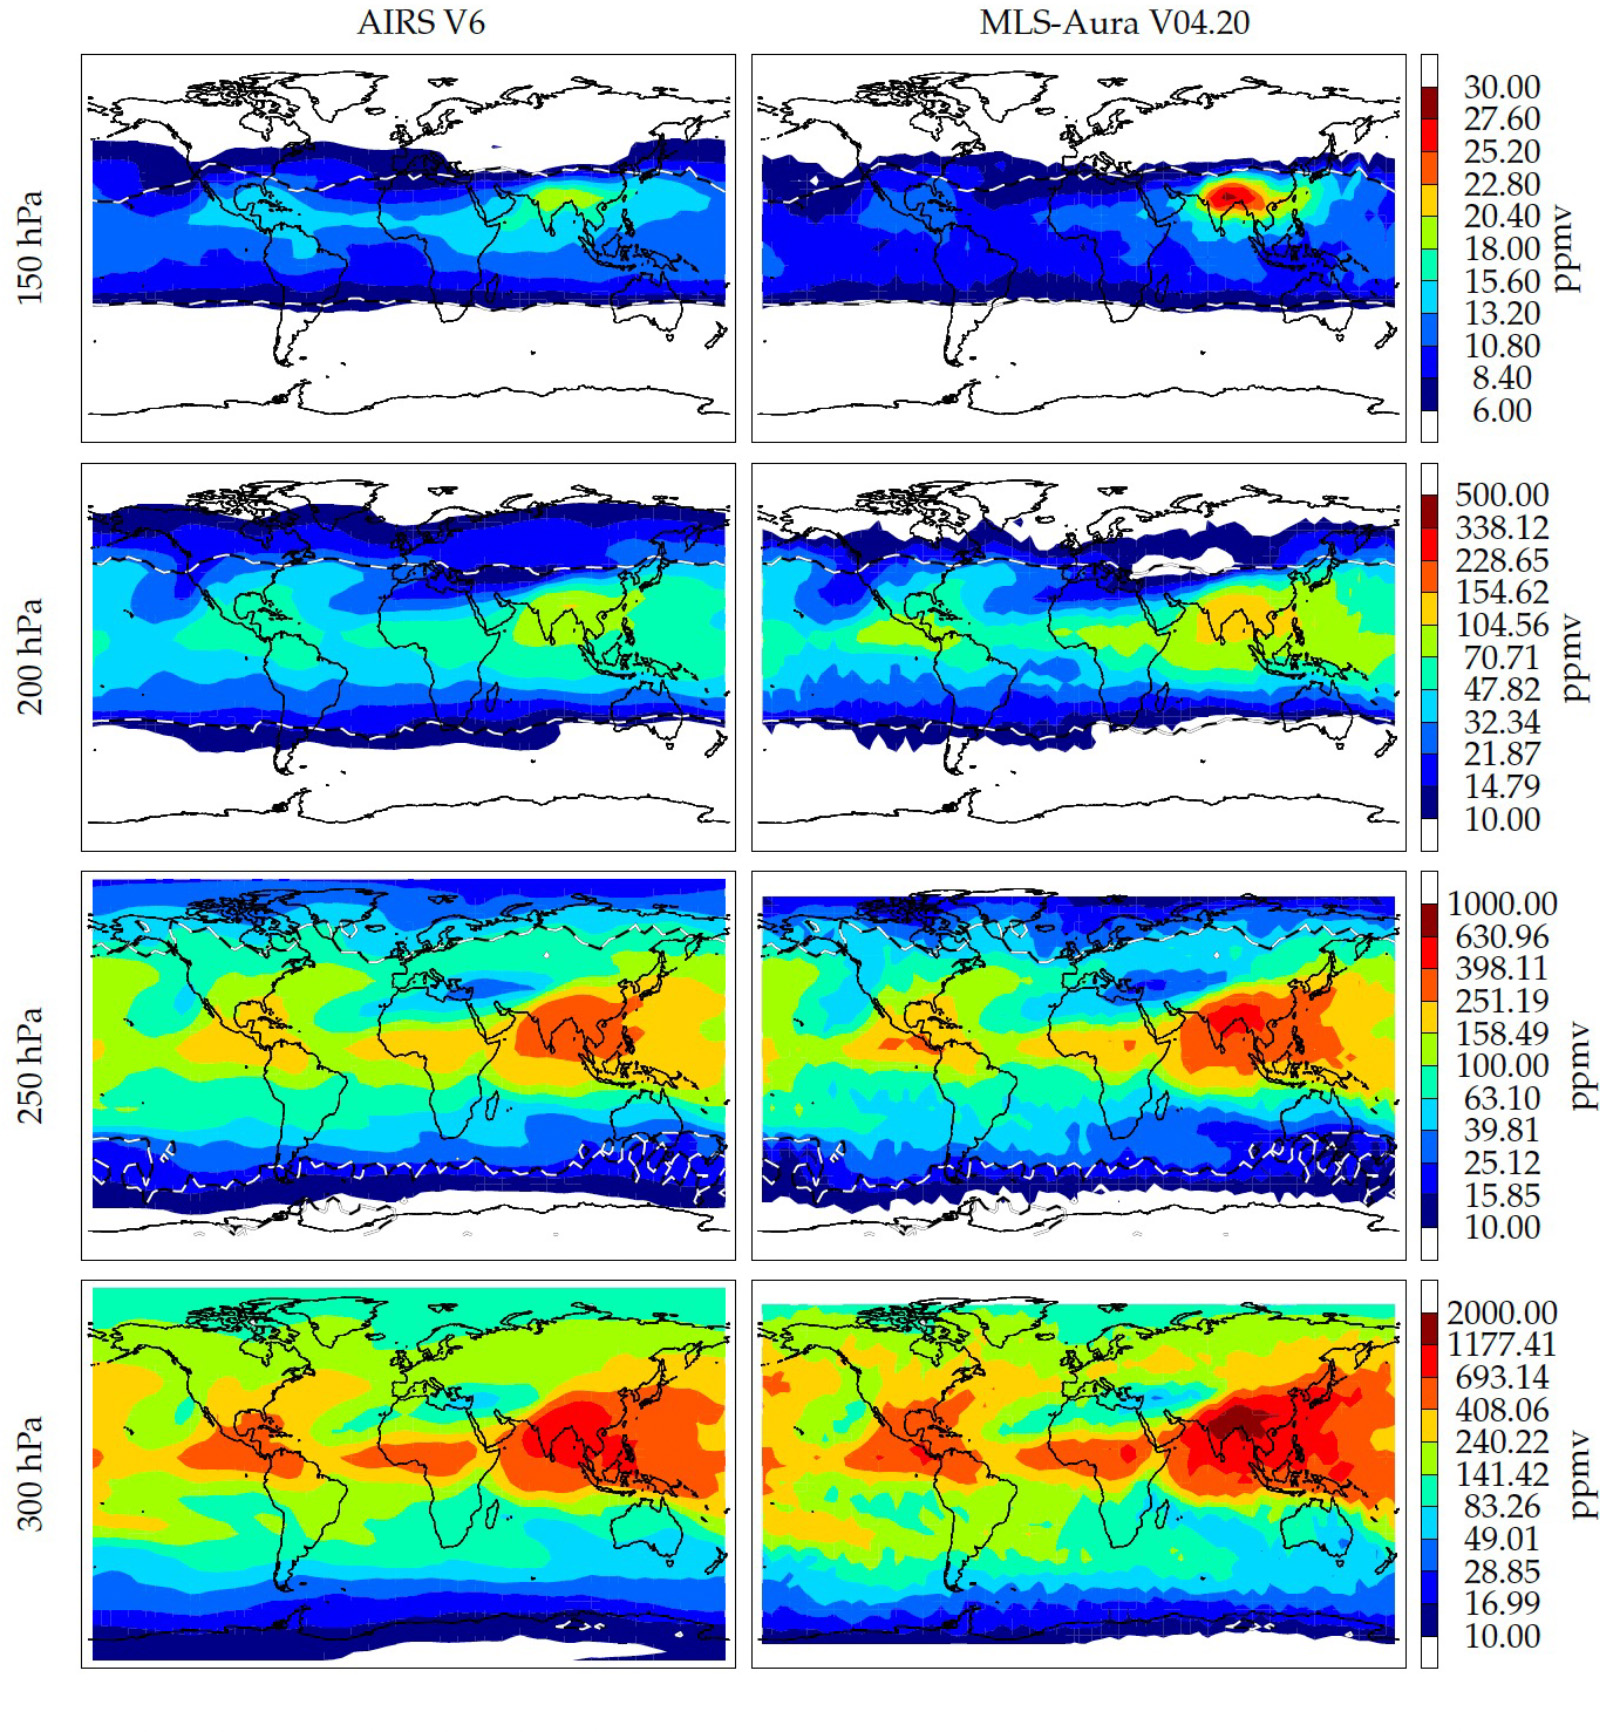
Gridded map comparison between MLS-Aura (v4.2) and AIRS (v6) during June—August 2012. The tropopause is shown as a black and white dashed contour line. Equatorward of this is in the troposphere and poleward of this line is in the stratosphere. The white regions are H2O < 10ppmv. MLS has no measurements poleward of 82°.
Data Sources:
The satellite data are available in a single database, WAVAS_SAHAR, DOI AIRS level-3 data The balloon frost-point data
Technical Description of Figure
The figure shows a gridded map comparison between AIRS v6 level 3 and MLS v4.2 level 2 humidity data products. Shown is a three-month (June—August 2012) example. Data from this time period is collected and averaged in 5°×4°(longitude and latitude) bins. Results for other time periods are similar to those shown here. This period was chosen because it shows a comparison during the northern hemisphere summer monsoon period, which accentuates high moisture features over the major land masses attributable to high convective activity during this time. The quantitative agreement is nominally within 10%, except at the concentration extremes where MLS reports greater humidity than AIRS in moist cases, and less humidity in drier ones. Both fields track the tropopause very well as shown by the black and white contour line. Air poleward of this line is in the stratosphere, typically characterized by < 10 ppmv concentrations (white regions). Equatorward of the contour line is in the troposphere with concentrations > 10 ppmv. In the case of MLS, there are no data poleward of 82°. One feature nicely highlighted here is the ability of these techniques to make measurements in the cloudy regions that show good quantitative agreement. AIRS is a nadir viewing instrument with a small spatial footprint that allows the use of a cloud correcting scheme. MLS is a limb viewer whose long path lengths often encounter clouds in the tropics but whose observations at long wavelength are unimpacted, except for within the thickest clouds.
Scientific significance, societal relevance, and relationships to future missions
Upper tropospheric humidity is an important field needed for quantifying the role of water vapor in climate feedbacks. AIRS is an instrument on the Aqua satellite which is part the EOS A-train. It has been succeeded by a similar instrument, CriS, on the NOAA-20 and Suomi-NPP satellites in operation. Another similar instrument, IASI, currently operates on EUMETSAT. The MLS instrument on the Aura satellite is also part of the EOS A-train. There is no follow-on instrument for MLS, which is unique in that it can make humidity measurements smoothly from the upper troposphere into the stratosphere and above. This is because the limb viewing technique does not require an atmospheric thermal gradient, but there are limits to the measurement range up to a few kilometers below the cold point tropopause for nadir-viewing thermal emission sounders.
Reference:
Read, W. G., Stiller, G., Lossow, S., Kiefer, M., Khosrawi, F., Hurst, D., Vomel, H., Rosenlof, K., Dinelli, B. M., Raspollini, P., Nedoluha, G. E., Gille, J. C., Kasai, Y., Eriksson, P., Sioris, C. E., Walker, K. A., Weigel, K., Burrows, J. P., and Rozanov, A., ”The SPARC Water Vapor Assessment II: Assessment of satellite measurements of upper tropospheric humidity,” Atmos. Meas. Tech., 15, 3377—3400, https://doi.org/10.5194/amt-15-3377-2022, 2022.
10.2022

