Aura's High Resolution Dynamics Limb Sounder (HIRDLS) reveals the global pattern of the double tropopause using the HIRDLS high vertical resolution profiles. Composition and structure near the tropopause are important for the Earth radiative balance and quantifying transport of ozone and other stratospheric species into the troposphere.
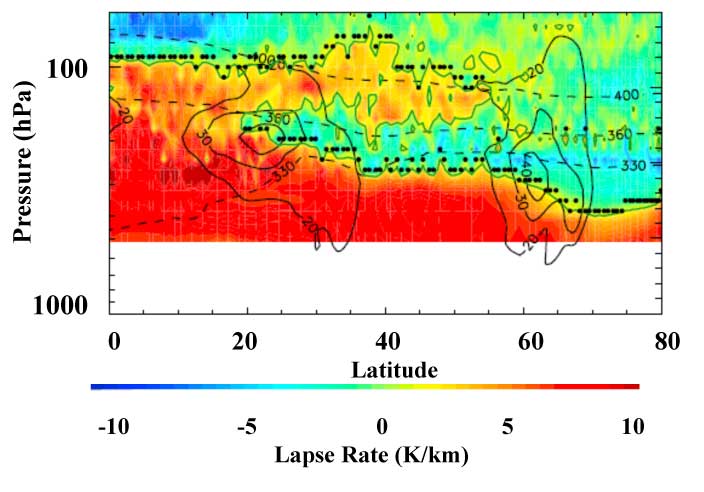
Figure 1: Along track cross section of the lapse rate calculated from HIRDLS temperatures at 08:00 UTC on 1/26/2006. Black filled circles indicate the tropopause identified using the WMO double tropopause criterion. The green contour denotes 2K/km. Zonal wind contours are solid black and potential temperature contours are dashed black.

Figure 2: Double tropopause frequency of occurrence is obtained from HIRDLS Level 2 data 2005 - 2007 for December-January-February. In each 3o latitude by 15o longitude bin the frequency is the percentage of profiles with a double tropopause. White contours are the mean zonal wind (solid white lines), on the 200 hPa pressure surface.
A prominent double tropopause is shown in the left figure. Northern hemisphere winter spatial variations of the chance for double tropopause occurrence are shown on the right. White contours are the seasonal mean zonal wind (m/s) at 200 hPa. HIRDLS measurements show that double tropopauses and hence air mass mixing are most likely to occur poleward of the subtropical jet during winter (red regions). HIRDLS measurements reveal the seasonal variation in double tropopause occurrence and also that interannual variability is largest during winter (not shown).
Reference: Peevey, T., et al., (2012), Investigation of double tropopause spatial and temporal global variability utilizing High Resolution Dynamics Limb Sounder temperature observations, J. of Geophys. Res.
Data Source: Temperature data from US/UK Limb Sounding Instrument (HIRDLS) on board of NASA Aura satellite: [go to web site]
Technical Description of Figure: Left figure is a contour plot of lapse rate data (obtained by calculating dT/dz, where T= Temperature and z=altitude) on 01/26/2006. The green contour line outlines 2 K/km lapse rate contour, clearly showing a prominent double tropopause on this day over the western US. The double tropopause is an overlap of the tropical/higher tropopause and polar/lower tropopause along the subtropical jet. The WMO definition of the double tropopause, established in 1957, is used to find the first and second tropopause, represented with black dots. The solid black contours represent the zonal wind and the black dashed lines represent isentropic surfaces. The figure on the right highlights where the double tropopause is most likely to occur (red regions), i.e. double tropopause frequency, during December-January-February (DJF). Two items are of interest in this plot. First, double tropopauses tend to form poleward of the subtropical jet. Second, that the poleward extent of the double tropopause is larger over the western half of the globe, suggesting a more active region (confirmed in Peevey et al.) [2012].
Significance: The double tropopause is a thermal structure in the atmosphere that has been connected, using radiosonde and aircraft data, to the transport of tropical upper tropospheric air into the lowermost stratosphere and visa versa. Three full years of HIRDLS data, 2005-2007, has shown global characteristics of the double tropopause, such as that they preferentially form along the subtropical jet, especially from the Pacific Ocean, across the US, to the Atlantic Ocean. These results highlight subtle variations in double tropopause frequency previously not seen, suggesting that irreversible mixing could be more common over the western half of the globe.
Relevance for future science: The high vertical and along-track resolution of Aura HIRDLS has shown new distributions of a fine-scale feature of the atmosphere called the double tropopause that is important for quantifying the current and future composition of the upper tropopause lower stratosphere (UTLS) region, a region of the atmosphere that is important for the radiative balance of the Earth and the transport of ozone into the troposphere from the stratosphere.
Other products in HIRDLS version 6, recently available, such as CFC's also have the potential to contribute to a greater understanding of air mass exchange and mixing in the UTLS due to the extension in the 'useful' vertical range. Therefore future science still has much to gain from the analysis of the HIRDLS data products.
02.01.2012

